Thread
Data Analysis is the most wanted skill for every business today.
Still, +80% businesses use Excel to Analyze Data.
Here are the Most Common Excel Functions used by Data Analysts.
- Thread -
Still, +80% businesses use Excel to Analyze Data.
Here are the Most Common Excel Functions used by Data Analysts.
- Thread -
As a Data Analyst, your job is to gather, clean, and study data sets to help solve problems.
In this thread, I will solve the most common question you would be asked to solve.
Let's get started
Here is a quick snapshot of the data set we going to use
(From March to December)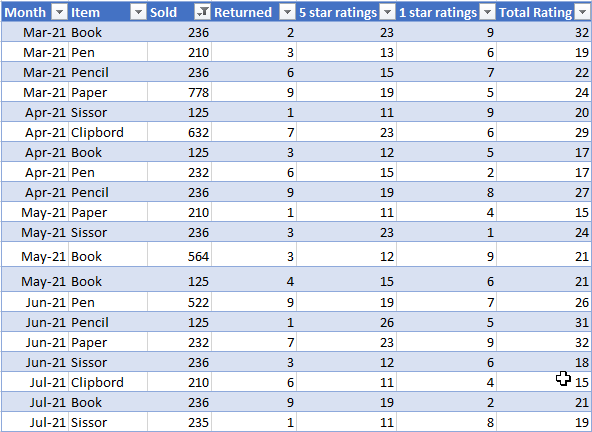
In this thread, I will solve the most common question you would be asked to solve.
Let's get started
Here is a quick snapshot of the data set we going to use
(From March to December)

1. How many Pens are Sold?
The total of a specific number of items sold.
Formula used: Formula =SUMIFS(dataset[Sold],dataset[[Item ]],L5)
The total of a specific number of items sold.
Formula used: Formula =SUMIFS(dataset[Sold],dataset[[Item ]],L5)
By using this method it is not limited to only one item (Pen),
If you write the item name in the cell (L5) you can get other items sold values too.
If you write the item name in the cell (L5) you can get other items sold values too.
2. How many Items were returned in Oct-21?
This will show you the total number of items returned in Oct-21.
Also, if you change the Month in L5 Cell, you can get the total number of returned items in that Month.
Formula used: =SUMIFS(dataset[Rreturned],dataset[Month],L5)
This will show you the total number of items returned in Oct-21.
Also, if you change the Month in L5 Cell, you can get the total number of returned items in that Month.
Formula used: =SUMIFS(dataset[Rreturned],dataset[Month],L5)
3. Total Sold in a Given Period.
This will show you how many items were sold in a given period of time.
Also, if you change the End or Start Date, values will change accordingly.
Formula used: =SUMIFS(dataset[Sold],dataset[Month],">="&L5,dataset[Month],"<="&L6)
This will show you how many items were sold in a given period of time.
Also, if you change the End or Start Date, values will change accordingly.
Formula used: =SUMIFS(dataset[Sold],dataset[Month],">="&L5,dataset[Month],"<="&L6)
4. How often did 1 item sell more than 500 times each month?
This will catch the number of times one item has sold more than 500 times.
Formula used: =COUNTIFS(dataset[Sold],">500")
This will catch the number of times one item has sold more than 500 times.
Formula used: =COUNTIFS(dataset[Sold],">500")
5. What is the Average of Item Returned?
This will show you the average of each item returned.
If you change the item name on Cell L5, you will get the average of that item returned.
Formular used: =AVERAGEIFS(dataset[Rreturned],dataset[[Item ]],L5)
This will show you the average of each item returned.
If you change the item name on Cell L5, you will get the average of that item returned.
Formular used: =AVERAGEIFS(dataset[Rreturned],dataset[[Item ]],L5)
Quick Break:
If you are interested in AI and Data Analysis.
Join: AiSuite.Beehiiv.com.
You will receive the most recent information regarding AI and Data Analysis.
Also, you will get this AI Tools Database. 👇
If you are interested in AI and Data Analysis.
Join: AiSuite.Beehiiv.com.
You will receive the most recent information regarding AI and Data Analysis.
Also, you will get this AI Tools Database. 👇

6. On Average How many Items have sold each Month?
This will give you an average of how many items were sold in each month.
Formula used: =AVERAGEIFS(dataset[Sold],dataset[Month],K6)
Do this one month and copy the formula using Flash Fill.
This will give you an average of how many items were sold in each month.
Formula used: =AVERAGEIFS(dataset[Sold],dataset[Month],K6)
Do this one month and copy the formula using Flash Fill.
7. What was the highest sale amount for each item and in which month did it occur?
This is a bit tricky, to show this data requires 2 steps.
1. Find the highest number of sales for each item.
2. Find out which month it happened.
Here is how you can complete this 👇👇
This is a bit tricky, to show this data requires 2 steps.
1. Find the highest number of sales for each item.
2. Find out which month it happened.
Here is how you can complete this 👇👇
1. Find the highest number of sales for each item.
Make a list of all items and then use this formula.
Formula used: =MAXIFS(dataset[Sold],dataset[[Item ]],K5)
2. Find out which month it happened.
Formula used: =INDEX(dataset[Month],MATCH(L5,dataset[Sold],0))
Make a list of all items and then use this formula.
Formula used: =MAXIFS(dataset[Sold],dataset[[Item ]],K5)
2. Find out which month it happened.
Formula used: =INDEX(dataset[Month],MATCH(L5,dataset[Sold],0))
8. Which month has the highest returned %?
To get to the final answer, we need to complete 3 steps
1. Get the total returned in each month
2. Get the total sold in each month
3. Get the %
Here is how you can complete this 👇👇
To get to the final answer, we need to complete 3 steps
1. Get the total returned in each month
2. Get the total sold in each month
3. Get the %
Here is how you can complete this 👇👇
1. Get the total returned in each month
Formula used: =SUMIFS(dataset[Returned],dataset[Month],K5)
2. Get the total sold in each month
Formula used: =SUMIFS(dataset[Sold],dataset[Month],K5)
3. Get the %
Formula used: =SUMIFS(dataset[Returned],dataset[Month],K5)
2. Get the total sold in each month
Formula used: =SUMIFS(dataset[Sold],dataset[Month],K5)
3. Get the %
That's a wrap!
If you enjoyed this thread:
1. Follow me @sharyph_ for more of these
2. RT the tweet below to share this thread with your audience
If you enjoyed this thread:
1. Follow me @sharyph_ for more of these
2. RT the tweet below to share this thread with your audience