Thread
Create Charts with Python using Matplotlib (with code snippets)
In this thread, we will learn how to create 5 interesting and beautiful charts using Python.
Follow me @itsafiz if you don't want to miss amazing Python content.
A Thread 🧵👇
In this thread, we will learn how to create 5 interesting and beautiful charts using Python.
Follow me @itsafiz if you don't want to miss amazing Python content.
A Thread 🧵👇

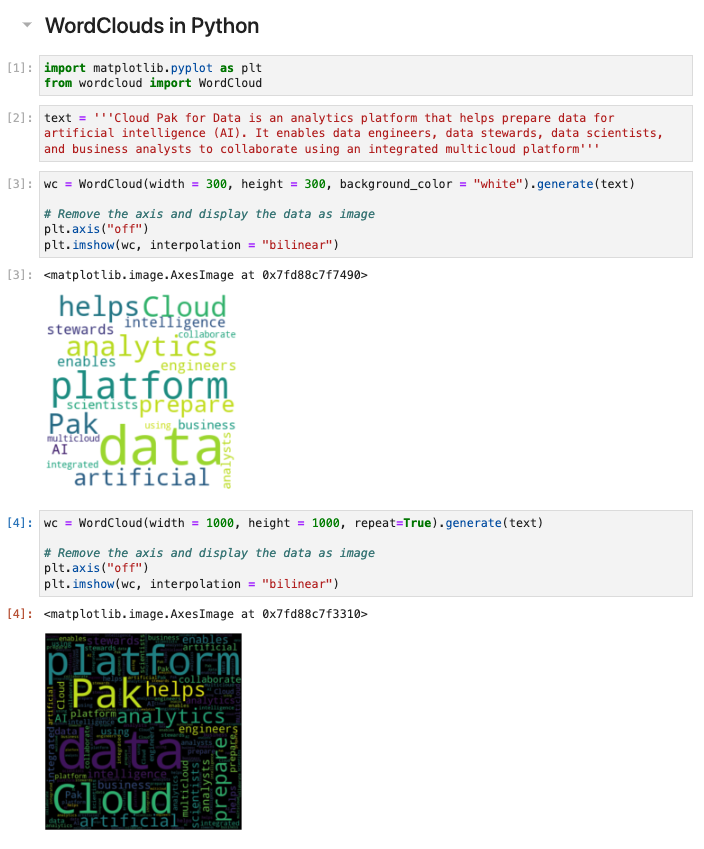
1. WordClouds in Python 
2. 2D histograms in Python 

3. Treemaps in Python 

4. Contour lines in Python 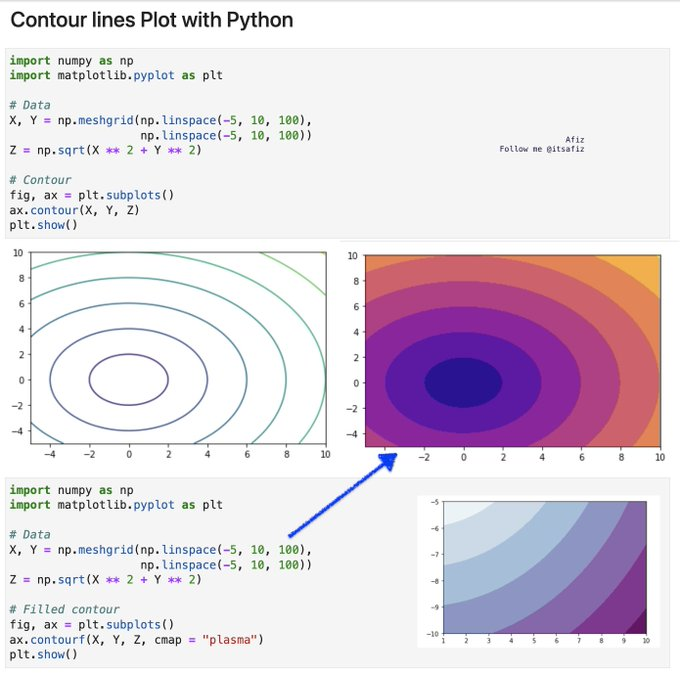

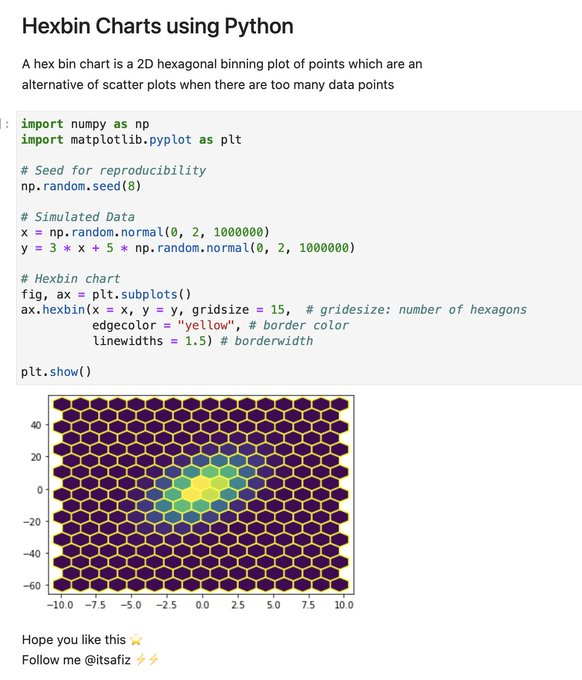
5. Hexabins in Python 
Check out my GitHub repo for all the Python and ML content:
github.com/afizs/be-theboss-in-python/blob/main/README.md
github.com/afizs/be-theboss-in-python/blob/main/README.md
That's a wrap!
If you enjoyed this thread:
1. Follow me @itsafiz for more Python and ML content.
2. RT the tweet below to share this thread with your audience
If you enjoyed this thread:
1. Follow me @itsafiz for more Python and ML content.
2. RT the tweet below to share this thread with your audience
Mentions
See All
Akshay 🚀 @akshay_pachaar
·
Jan 19, 2023
Great content!!