Thread
Linear Regression in 5+1 easy steps!
Create a predictive model in Python using scikit-learn
Linear Regression - Day 5
🧵
Create a predictive model in Python using scikit-learn
Linear Regression - Day 5
🧵
1️⃣ Import packages and read the dataset
We will use
- Pandas and NumPy for data manipulation
- Matplotlib for visualization
- Scikit-learn for the model
We want to predict Sales based on money spent on TV advertisements
1/7
We will use
- Pandas and NumPy for data manipulation
- Matplotlib for visualization
- Scikit-learn for the model
We want to predict Sales based on money spent on TV advertisements
1/7
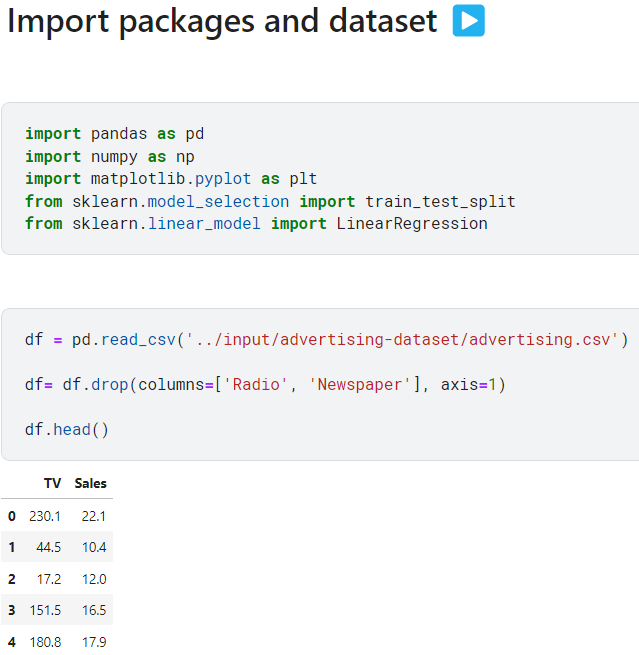
Note:
Two columns: Radio and Newspaper have been dropped.
This way we can focus only on two variables:
- Money spent on TV advertisements
- Sales - our target variable
2/7
Two columns: Radio and Newspaper have been dropped.
This way we can focus only on two variables:
- Money spent on TV advertisements
- Sales - our target variable
2/7
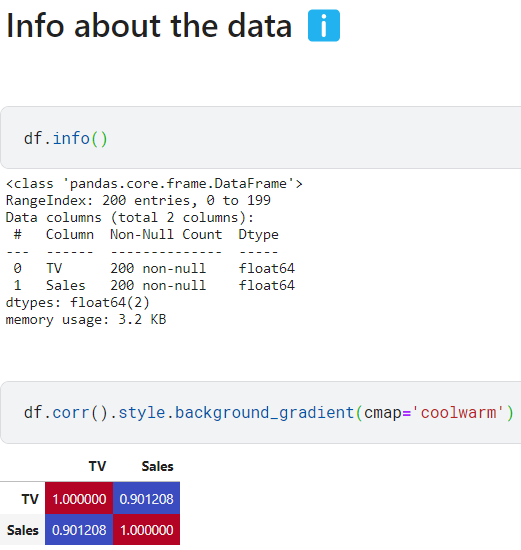
2️⃣ Info about our data
We have 200 entries.
- TV column shows the spending in thousand of $.
- Sales column is the thousand of units sold.
According to the correlation matrix, TV advertisements and Sales are strongly correlated.
3/7
We have 200 entries.
- TV column shows the spending in thousand of $.
- Sales column is the thousand of units sold.
According to the correlation matrix, TV advertisements and Sales are strongly correlated.
3/7
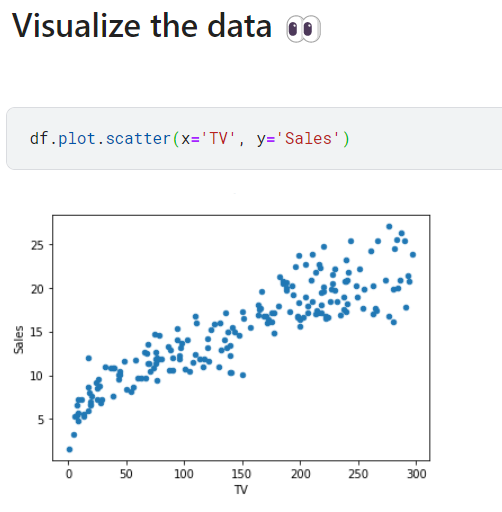
3️⃣ Visualize the data
Plotting our data will confirm the correlation:
- Spending more on TV advertising seems to have a positive effect on Sales 🔽
4/7
Plotting our data will confirm the correlation:
- Spending more on TV advertising seems to have a positive effect on Sales 🔽
4/7
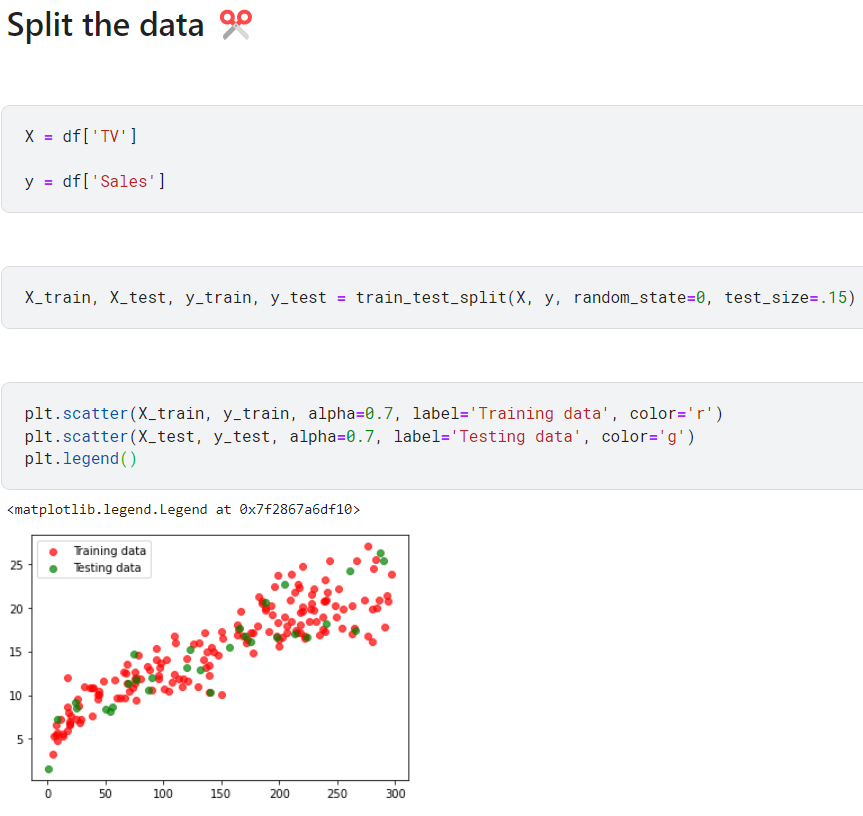
4️⃣ Split the data
X: TV ads are our feature variables
Y: Sales are our target variables
- We split the data into a training set and a testing set.
- Visualize these sets seperetadly
5/7
X: TV ads are our feature variables
Y: Sales are our target variables
- We split the data into a training set and a testing set.
- Visualize these sets seperetadly
5/7
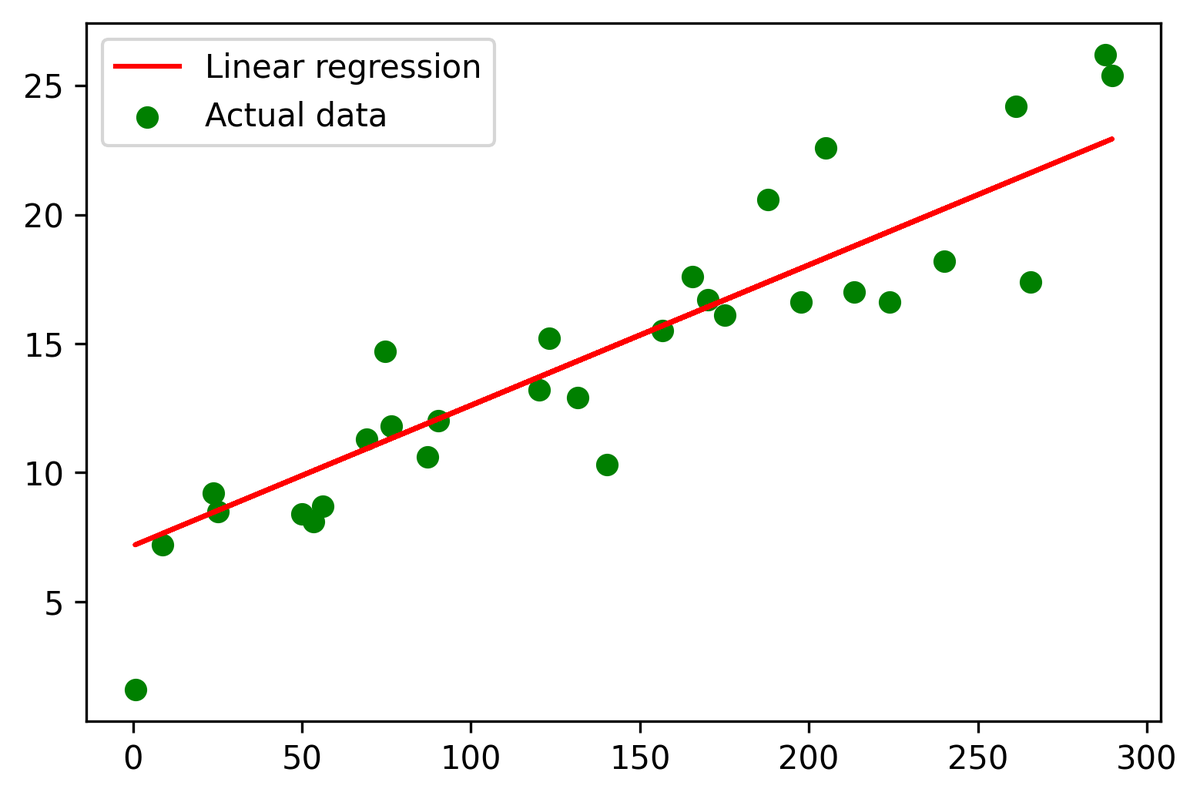
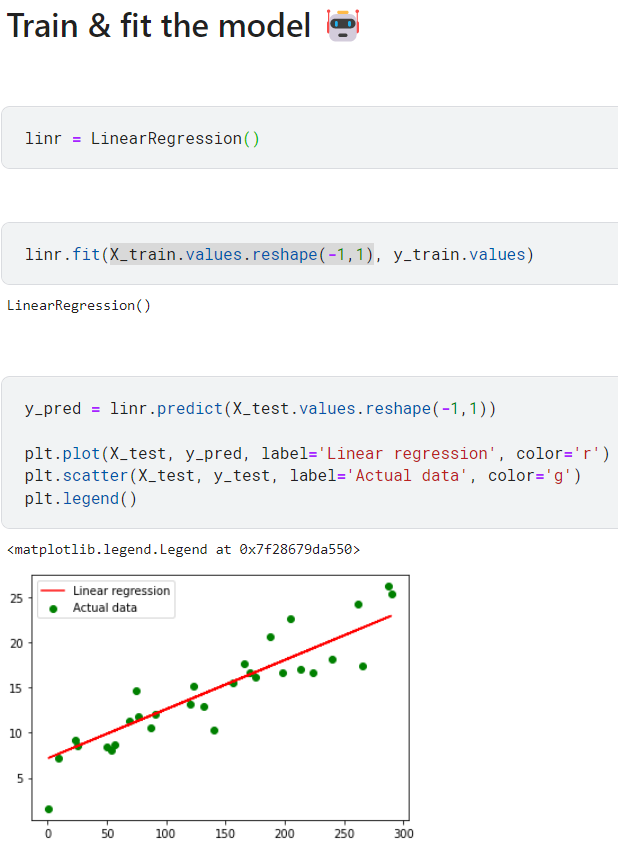
5️⃣ Train the Linear Regression model
1. We fit the model to the training dataset
2. Make the predictions using the testing dataset
3. Plot the predictive model and the actual testing values
6/7
1. We fit the model to the training dataset
2. Make the predictions using the testing dataset
3. Plot the predictive model and the actual testing values
6/7
6️⃣ Finally we can make a prediction & calculate the MSE
- According to the model if a company spends $150 000 on TV ads, its expected sales will be 15.3K units.
(Go back and look at the chart to confirm 😉)
- Calculate the Mean Square Error
7/7
- According to the model if a company spends $150 000 on TV ads, its expected sales will be 15.3K units.
(Go back and look at the chart to confirm 😉)
- Calculate the Mean Square Error
7/7

You can find my Kaggle notebook here:
www.kaggle.com/leventekulcsar/linear-regression-simple-explanation
www.kaggle.com/leventekulcsar/linear-regression-simple-explanation
If you want to read my previous Linear Regression 🧵 s, you can do it here:
twitter.com/i/events/1590049300582735876?s=20
twitter.com/i/events/1590049300582735876?s=20
That's it for today.
I hope you've found this thread helpful.
Like/Retweet the first tweet below for support and follow @levikul09 for more Data Science threads.
Thanks 😉
I hope you've found this thread helpful.
Like/Retweet the first tweet below for support and follow @levikul09 for more Data Science threads.
Thanks 😉
Mentions
See All
Levi @levikul09
·
Jan 16, 2023
- Curated in Simplest Explanation of Linear Regression