Thread
The math behind the lines
Linear Regression - Day 2
Let's see the actual math behind the predictive model ⬇️
🧵
Linear Regression - Day 2
Let's see the actual math behind the predictive model ⬇️
🧵

If you haven't read the basics yesterday, start here 🔽
1/6
1/6
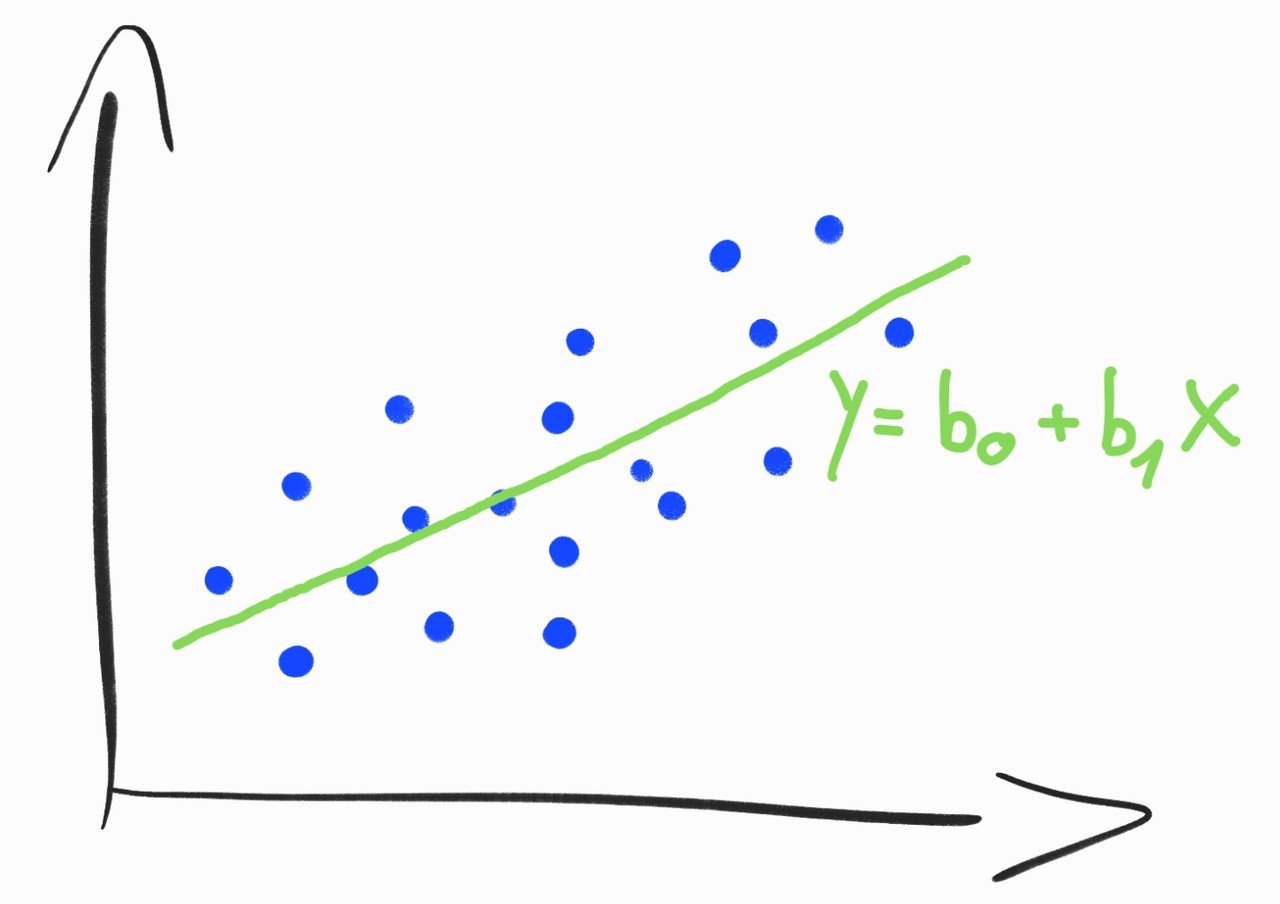
Linear Regression tries to predict the Y variable from X using a linear relationship.
The linear relationship can be visualized as a line.
Mathematically we can write down lines like this 🔽
2/6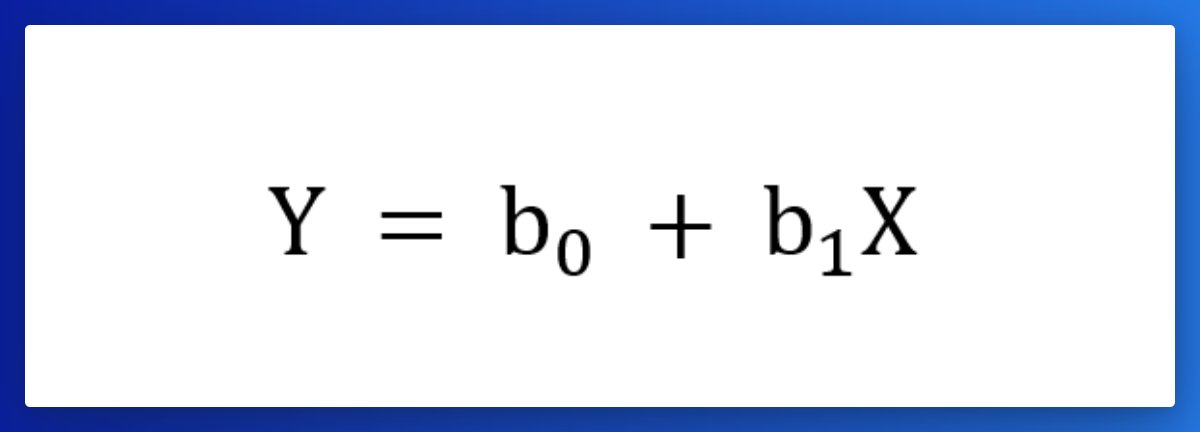
The linear relationship can be visualized as a line.
Mathematically we can write down lines like this 🔽
2/6

In the formula:
- b0 is the point where the line intercepts the y-axis.
- b1 is the slope of the line.
When the slope is 0.5, it means that when we walk along this line, for every unit that we move to the right, we are moving 0.5 units up.
3/6
- b0 is the point where the line intercepts the y-axis.
- b1 is the slope of the line.
When the slope is 0.5, it means that when we walk along this line, for every unit that we move to the right, we are moving 0.5 units up.
3/6

To find the perfect line the model modifies the b0 and b1 parameters.
It can
- Rotate (increase or decrease slope)
- Translate up and down (modify the y-intercept)
The model does this process until it finds the line that is closest to all the points in the dataset.
4/6
It can
- Rotate (increase or decrease slope)
- Translate up and down (modify the y-intercept)
The model does this process until it finds the line that is closest to all the points in the dataset.
4/6

Using the House price example yesterday we
- draw the regression line
- figured out that the price of a house with 4 rooms will be around 300
5/6
- draw the regression line
- figured out that the price of a house with 4 rooms will be around 300
5/6

The equation for this line is:
y = 61,286x + 52,69
Remember:
Y - the predicted value
x - the attribute = 4
b0 - y-intercept = 52,69
b1 - slope = 61,286
After plugging in:
297.834 = 61.286 (4) + 52.69
The predicted price for a house with 4 rooms is 297.834
6/6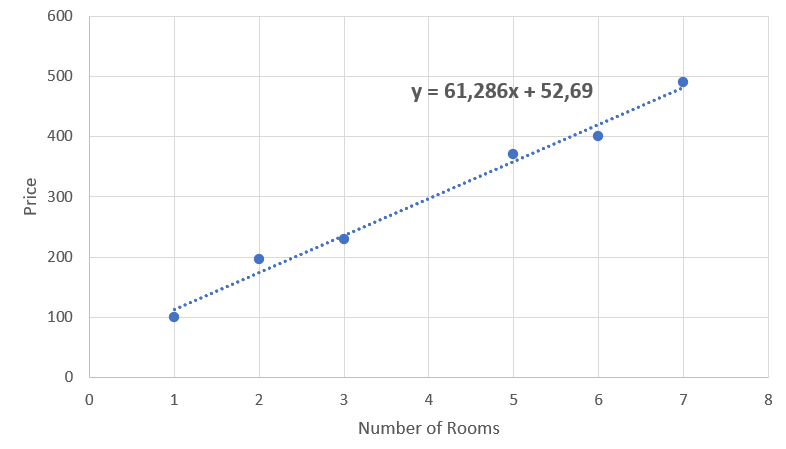
y = 61,286x + 52,69
Remember:
Y - the predicted value
x - the attribute = 4
b0 - y-intercept = 52,69
b1 - slope = 61,286
After plugging in:
297.834 = 61.286 (4) + 52.69
The predicted price for a house with 4 rooms is 297.834
6/6

That's it for today.
Tomorrow I will show you how we measure our results and errors in the model.
If you don't want to miss it, follow @levikul09
For support Retweet and Like the first tweet of this Thread.
Thanks 😉
Tomorrow I will show you how we measure our results and errors in the model.
If you don't want to miss it, follow @levikul09
For support Retweet and Like the first tweet of this Thread.
Thanks 😉
Mentions
See All
Levi @levikul09
·
Jan 16, 2023
- Curated in Simplest Explanation of Linear Regression