Thread
The endless scrolling Debt Clock.
What is it, and what exactly do all the numbers tell us?
Time for a Debt 🧵👇
What is it, and what exactly do all the numbers tell us?
Time for a Debt 🧵👇
⏰ What is the Debt Clock?
Some of you are old enough to remember back in 1989, when real estate investor Seymour Durst had this version of the debt clock installed on 42nd Street and Sixth Avenue in New York City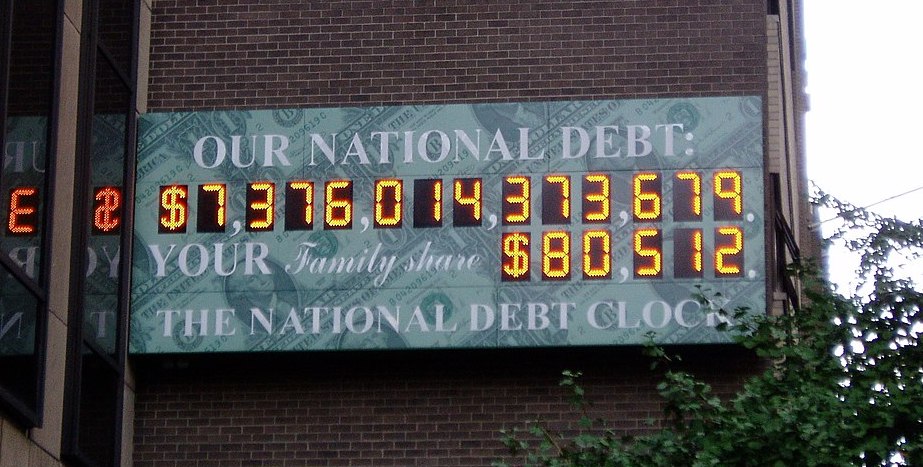
Some of you are old enough to remember back in 1989, when real estate investor Seymour Durst had this version of the debt clock installed on 42nd Street and Sixth Avenue in New York City

I remember being astounded by the numbers, even a little concerned, though I was still a teenager
Some say this shock value worked
It woke up the average person to the growing debt problem.
But did it really?
Some say this shock value worked
It woke up the average person to the growing debt problem.
But did it really?
Because, flash forward to today, and we all know the situation has only gotten worse
Far far worse.
Perhaps the numbers are just too large to grasp, too intangible for the average person to digest, even with the per family share displayed right alongside the total tally
Far far worse.
Perhaps the numbers are just too large to grasp, too intangible for the average person to digest, even with the per family share displayed right alongside the total tally
Or perhaps people just feel helpless
The government will do whatever it wants, regardless of who we elect. Regardless of what we request, what we demand
Either way, the national debt implications are quickly going from highly concerning to outright ominous
The government will do whatever it wants, regardless of who we elect. Regardless of what we request, what we demand
Either way, the national debt implications are quickly going from highly concerning to outright ominous
And now, in the advent of the Internet and smartphones, we can just load a web page or an app on our smartphone and we have this running total and much much more, right at our fingertips
As you may know, the anonymously run usdetclock.org debt clock looks like this:
As you may know, the anonymously run usdetclock.org debt clock looks like this:

This is a mass of numbers and information, so let’s focus in on some of the most important and telling ones today
First, if we zoom in on the upper left corner, we can see the total US National Debt, as reported by the Congressional Budget Office (CBO).
First, if we zoom in on the upper left corner, we can see the total US National Debt, as reported by the Congressional Budget Office (CBO).

For those removed from the world of finance and government, this is basically all the money the US has borrowed from people, companies, other governments, and other countries’ people
It represents all the US Treasuries outstanding that will need to be paid back at some point
It represents all the US Treasuries outstanding that will need to be paid back at some point
After all, they are just bonds. Albeit a monumental pile of them
$31.473 trillion to be exact
And this works out to be ~$94K of debt per citizen or $247K per taxpayer
$31.473 trillion to be exact
And this works out to be ~$94K of debt per citizen or $247K per taxpayer
Just below this, we see the official US Federal Spending, as reported by the CBO, is just under $6T, making the annual shortfall (the US Federal Budget Deficit) $1.31T
This is the amount of new debt the Treasury must issue to fund the budget and pay off previous, maturing debt.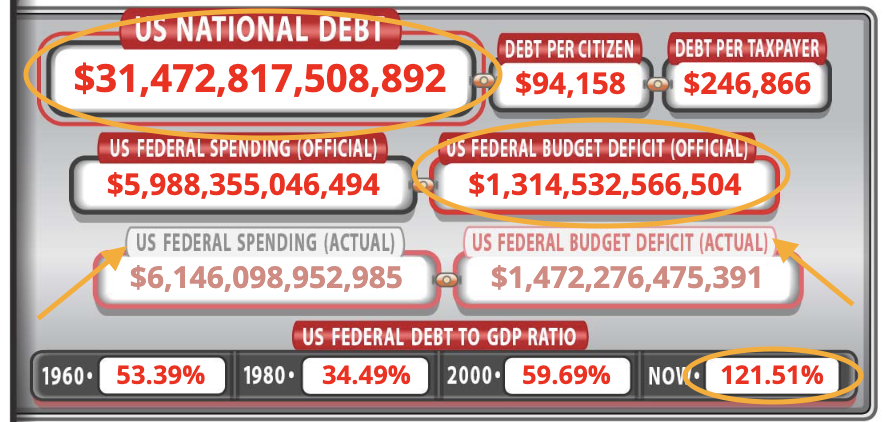
This is the amount of new debt the Treasury must issue to fund the budget and pay off previous, maturing debt.

Below these, and slightly grayed out, we see actual figures (see orange arrows)
These include what are deemed off-budget totals to get a closer approximation of what the government will actually spend, as opposed to what the CBO reports spending
Moving on...
These include what are deemed off-budget totals to get a closer approximation of what the government will actually spend, as opposed to what the CBO reports spending
Moving on...
Zooming into the upper right side of the clock…
…we see the US Federal Tax Revenue total, $4.67T
To the right of this box, is the breakdown of this total, made up of Income Tax Revenues, Payroll Taxes, Corporate Taxes, and Tariffs, which all add up to that $4.67T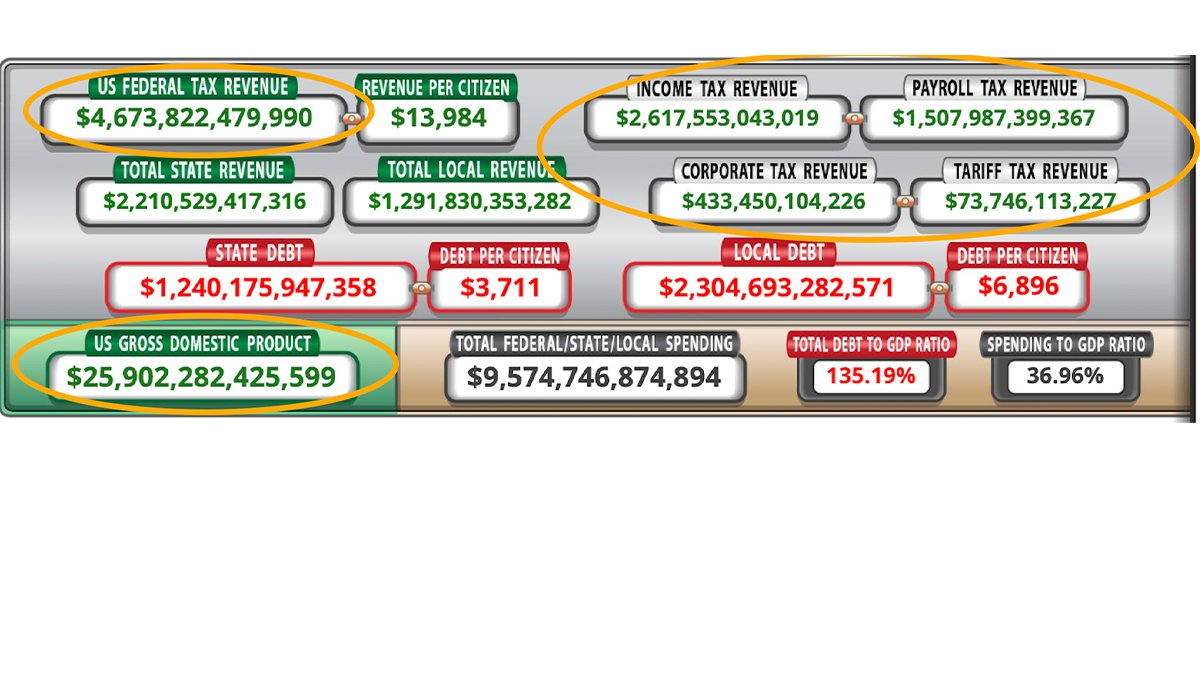
…we see the US Federal Tax Revenue total, $4.67T
To the right of this box, is the breakdown of this total, made up of Income Tax Revenues, Payroll Taxes, Corporate Taxes, and Tariffs, which all add up to that $4.67T

Taxes, of course, are just a function of the total US GDP, listed on the bottom left, totaling $25.9T
Remember, higher GDP = higher tax revenues, and vice versa
Of course, it's a bit more complicated than that, but for the purposes of today—just know these are highly correlated
Remember, higher GDP = higher tax revenues, and vice versa
Of course, it's a bit more complicated than that, but for the purposes of today—just know these are highly correlated
So, unless the government somehow spends less (hahahahahahahaha 🤡), then:
The higher the GDP, the higher the taxes, the lower the deficit
The lower the GDP, the lower the taxes, the higher the deficit
The higher the GDP, the higher the taxes, the lower the deficit
The lower the GDP, the lower the taxes, the higher the deficit
Peek back to the left hand side and we see the Debt to GDP number and how it has fluctuated:
53% in 1960 → 34% in 1980 → 59% in 2000 → 121% today
Whoa.
53% in 1960 → 34% in 1980 → 59% in 2000 → 121% today
Whoa.

Now there are a whole lot more numbers here, and some super interesting ones, like workforce and income numbers, as well as student loan debt, credit card debt, and personal debt per citizen
But I would like to direct your attention to two more key numbers that are on this page
But I would like to direct your attention to two more key numbers that are on this page
First, in the middle left box, we see the Largest Budget Items broken into categories. These are where the US Government is spending the most annually.
The largest pieces of that $4.67T of total spending, here’s $4.15T of it:
The largest pieces of that $4.67T of total spending, here’s $4.15T of it:

You may have heard me speak about this recently, or seen the Informationist Newsletter detailing what we call a debt spiral, and showing how the US has already entered one.
If you have not read that yet, you can find it for free, here:
jameslavish.substack.com/p/-whats-a-debt-spiral-and-is-the-us
If you have not read that yet, you can find it for free, here:
jameslavish.substack.com/p/-whats-a-debt-spiral-and-is-the-us
TL;DR: Because the US Government spends far more than it makes, it has to keep borrowing,
and with interest rates rising this past year, the spending deficit has only widened with higher interest expense, making the matters worse.
and with interest rates rising this past year, the spending deficit has only widened with higher interest expense, making the matters worse.
Another not-so-unimportant-but-so-big-it-blows-the-mind number I’d like you to note is the one all the way down at the bottom, labeled US Unfunded Liabilities
This is all the money the US Government owes on top of the US Federal Debt
You read that right.
This is all the money the US Government owes on top of the US Federal Debt
You read that right.

The US Government owes another $173T to pay off various programs, like Medicare and Social Security
That makes $204T (yes, Trillion dollars) that the US Government currently owes people
The *we are so screwed* moment
And now, a *moment of silence* for the US Treasury, please.
That makes $204T (yes, Trillion dollars) that the US Government currently owes people
The *we are so screwed* moment
And now, a *moment of silence* for the US Treasury, please.
More on that, but first, let’s slip back in time to see where we’ve come from
Then we can talk about where we are going...
Then we can talk about where we are going...
🫥 Back in Time
One neat little feature of the Debt Clock (located on the upper right hand side) is the ability to enter a Time Machine of sorts
And sending the clock back to this day in 1980, we can see a few interesting data points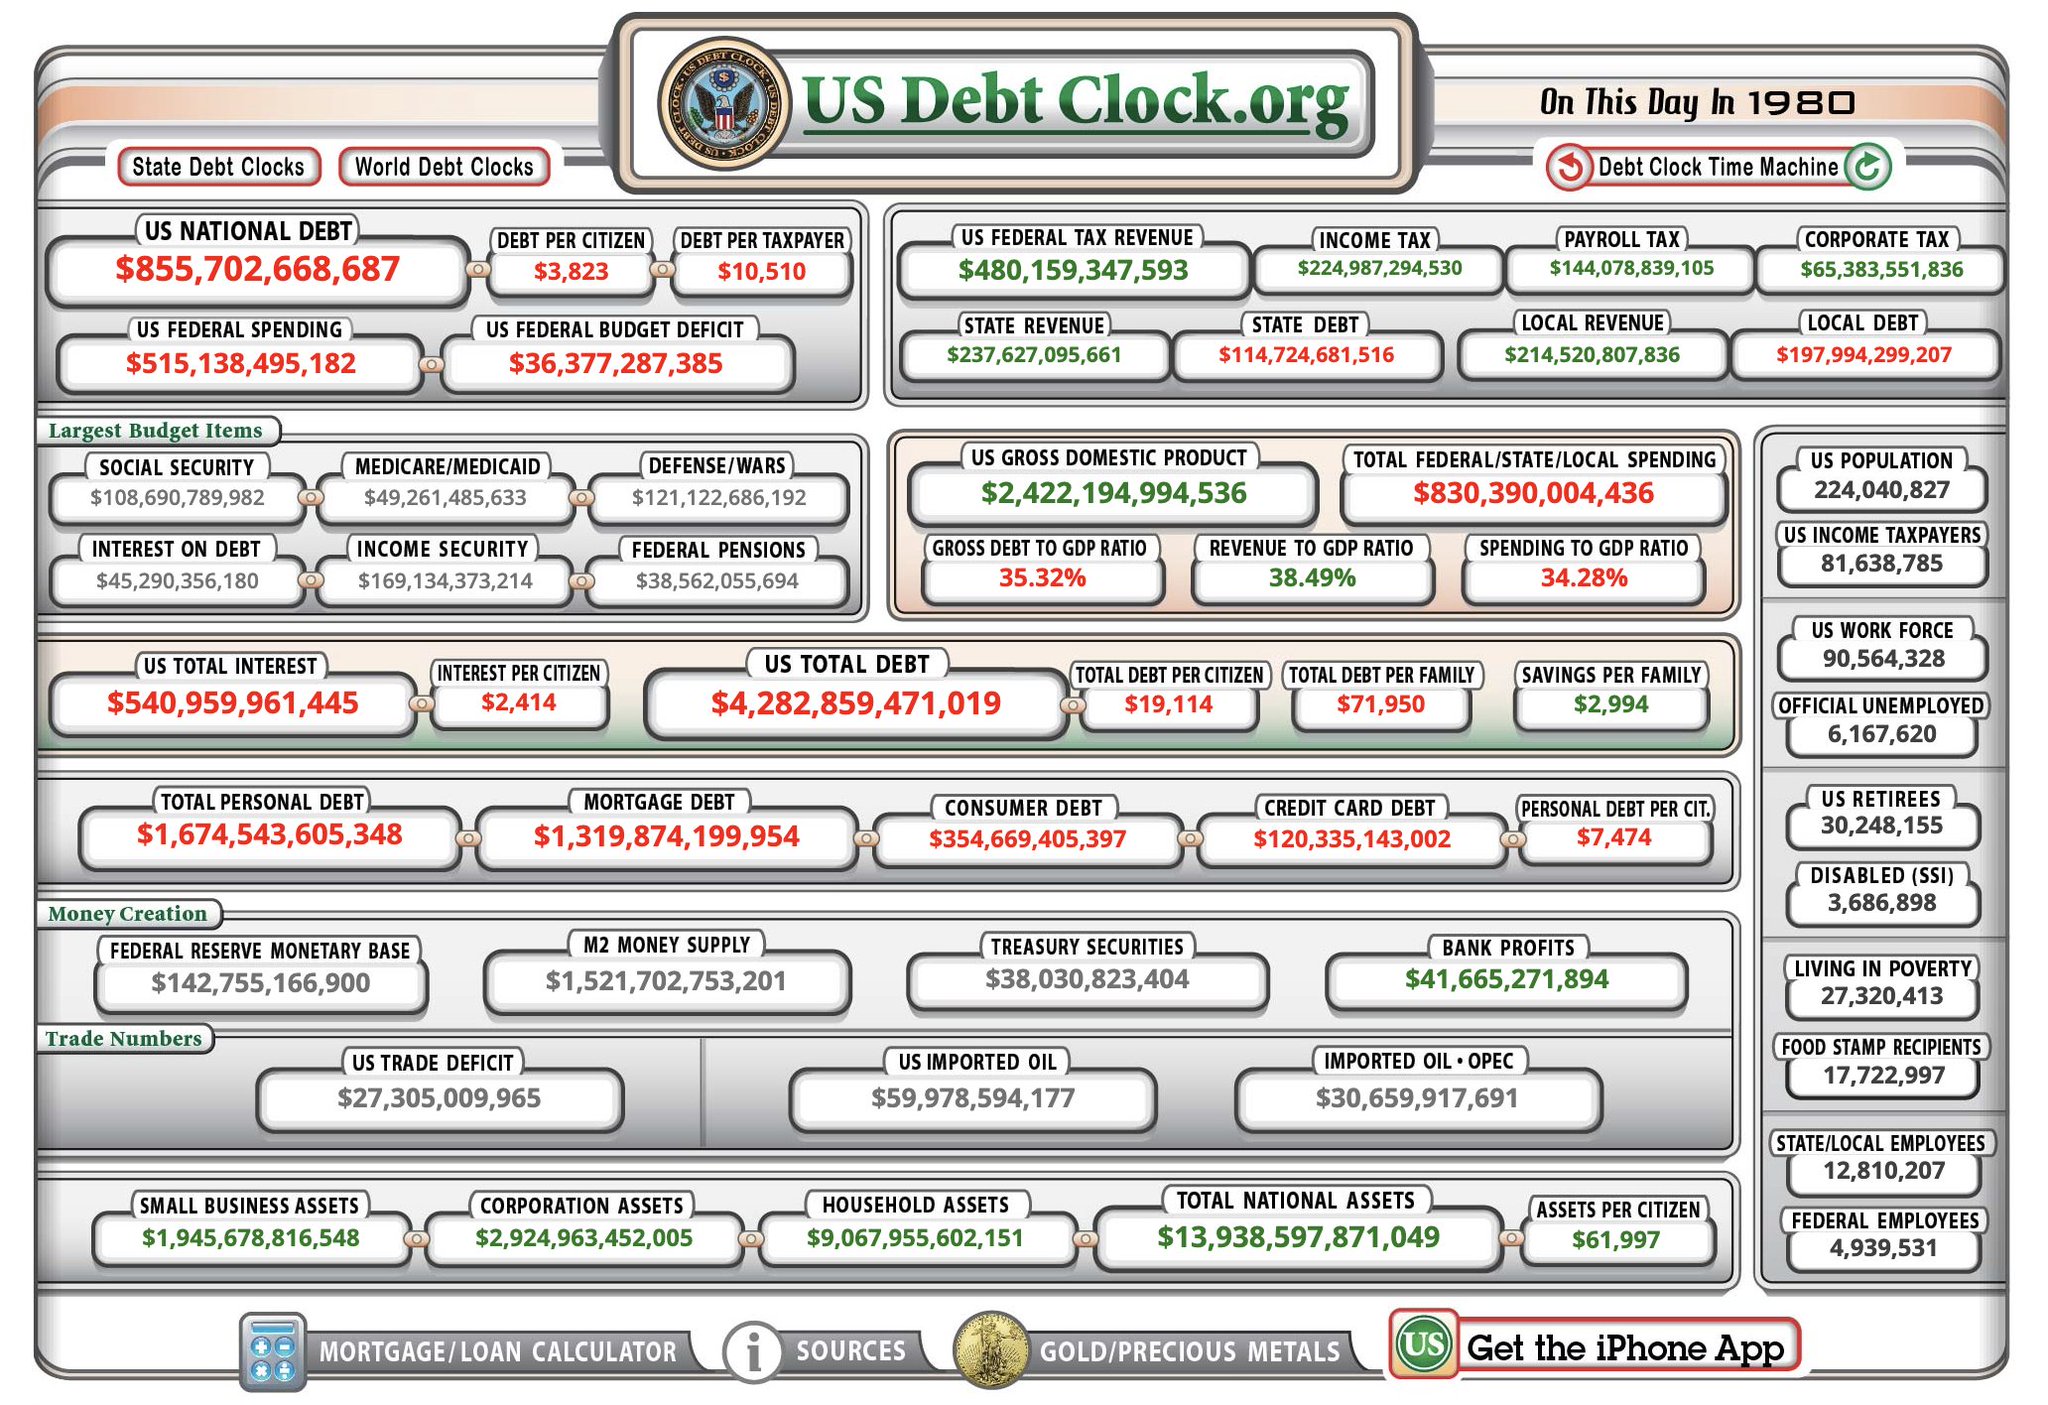
One neat little feature of the Debt Clock (located on the upper right hand side) is the ability to enter a Time Machine of sorts
And sending the clock back to this day in 1980, we can see a few interesting data points

First, the US National Debt was only $855 billion in 1980. Some quick math tells us that this number has grown ~37X since then
And, no surprise, the US Federal Budget Deficit has done pretty much the same
Also up ~37X
Oops?
And, no surprise, the US Federal Budget Deficit has done pretty much the same
Also up ~37X
Oops?
Yet, GDP is only up 11x. And hence, US Federal Tax Revenues are only up ~10X
It is therefore no surprise that the Federal Debt to GDP ratio has ballooned from 35% in 1980 to 121% today
Impressive.
It is therefore no surprise that the Federal Debt to GDP ratio has ballooned from 35% in 1980 to 121% today
Impressive.
This of course leads us to ask, is this as bad as it is going to get?
Surely we will have another fluctuation that leads us to close the spending gap, right?
Surely we can’t keep going like this. Borrowing ad nauseam
Can we?
Well, let’s peer into the near future and see…
Surely we will have another fluctuation that leads us to close the spending gap, right?
Surely we can’t keep going like this. Borrowing ad nauseam
Can we?
Well, let’s peer into the near future and see…
😵💫 Back to the Future
Once again, using the CBO’s own projections (ones that are mightily optimistic, I may add, having done a few calculations myself), we see that the situation does not, in fact, get any better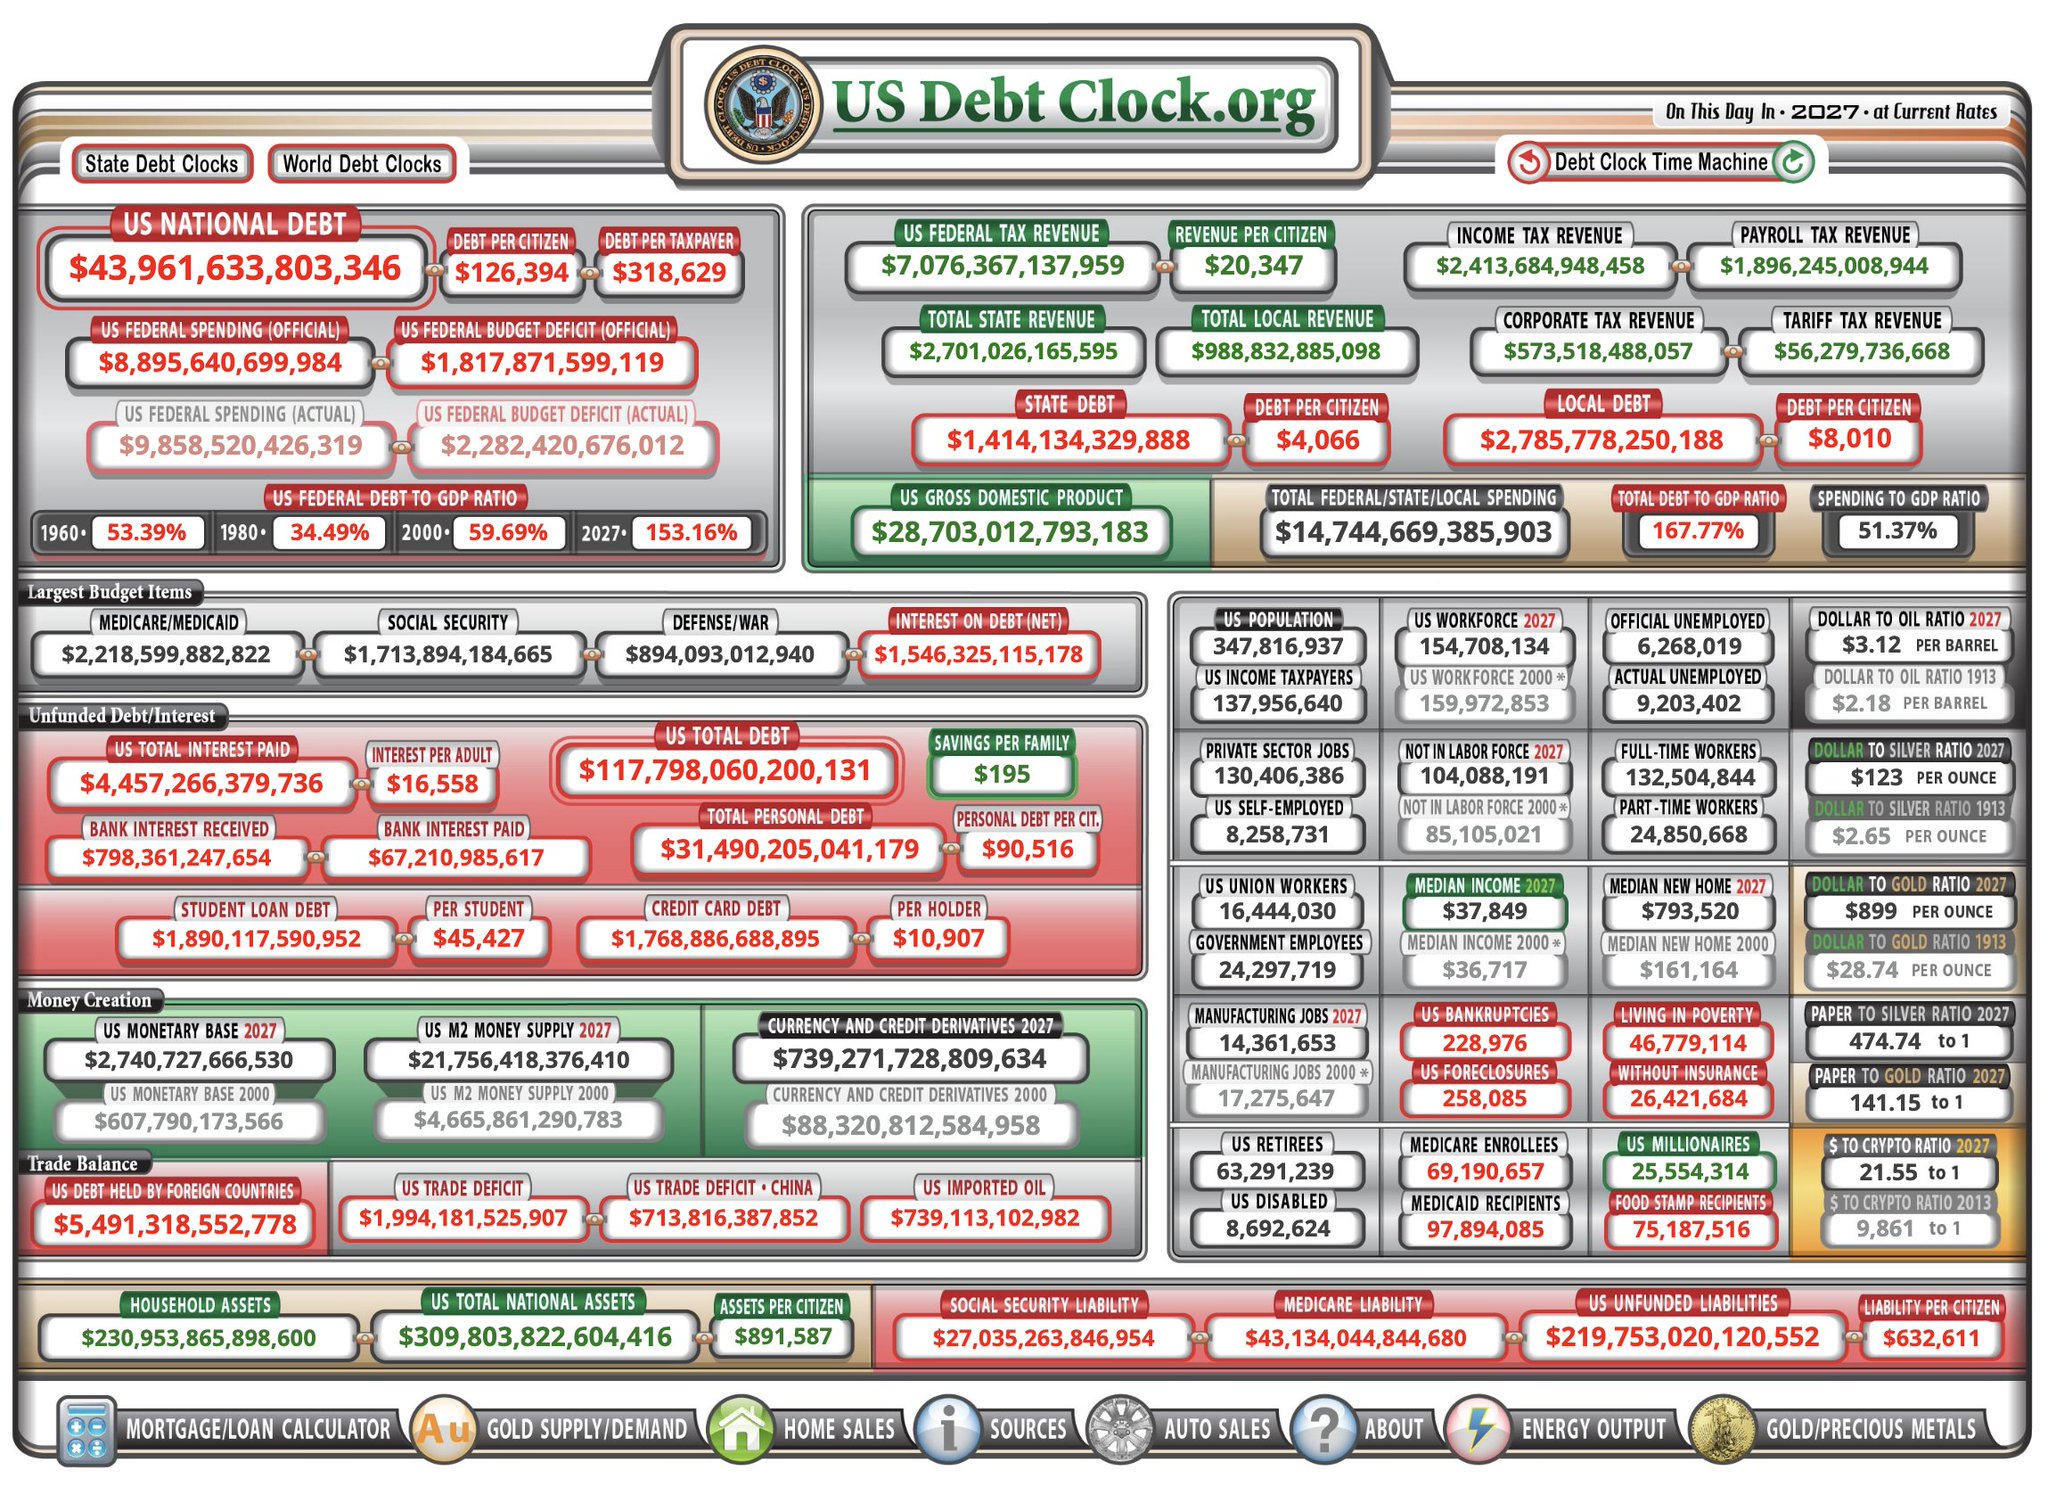
Once again, using the CBO’s own projections (ones that are mightily optimistic, I may add, having done a few calculations myself), we see that the situation does not, in fact, get any better

By the year 2027, the CBO itself projects a deficit of $1.8T, a jump of about 40%, and the National Debt growing to an eye-watering $44T
In just four more years!
Add in the $220T of Unfunded Liabilities, and whammo
Uhhh…Houston?
In just four more years!
Add in the $220T of Unfunded Liabilities, and whammo
Uhhh…Houston?
🫣 Implications for Today
So, what exactly does this have to do with the Fed being at odds with the Treasury?
So, what exactly does this have to do with the Fed being at odds with the Treasury?
Well, if you’ve been following people like @FossGregfoss, @LawrenceLepard, & @LukeGromen, and me, you’ve no doubt heard about the US Fed causing growing deficits and the precarious position in which the US now finds itself.
In short, inflation has been raging, and the Fed has been raising interest rates and draining money (M2) from the system via quantitative tightening to counter the rise in prices
This has the effect of a few major impacts to the numbers on the Debt Clock
This has the effect of a few major impacts to the numbers on the Debt Clock
First, rising rates and tighter money supply means that companies will be less profitable
This leads to lower Corporate Tax Revenues, as well as lower valuations in the stock market, and so, lower capital gains and hence, lower Income Tax Revenues
Exactly.
This leads to lower Corporate Tax Revenues, as well as lower valuations in the stock market, and so, lower capital gains and hence, lower Income Tax Revenues
Exactly.
GDP contracts, and the US Treasury collects less in tax revenues.
This means, without Congress lowering or slashing budget items, the Federal Deficit grows
The US Treasury must then borrow even more money
But wait. There’s more...
This means, without Congress lowering or slashing budget items, the Federal Deficit grows
The US Treasury must then borrow even more money
But wait. There’s more...
Add higher interest rates to the US Treasuries being auctioned in order to fund this growing deficit and the Interest On Debt number rises, causing the deficit gap to widen even more
The dreaded Debt Spiral.
The dreaded Debt Spiral.
So, at some point here in the near future, the Fed will need to stop raising interest rates
The US Treasury will more or less demand they do
After all, erring on allowing a little higher inflation helps the Treasury inflate away all this accumulated debt
The US Treasury will more or less demand they do
After all, erring on allowing a little higher inflation helps the Treasury inflate away all this accumulated debt
If the Fed doesn’t stop raising, at best, the spending gap widens, the debt balloons further, debt to GDP increases, and the US Treasuries become a more risky investment
*Note: there’s no such thing as ‘risk-free’
*Note: there’s no such thing as ‘risk-free’
At worst, the Fed plunges the US economy into a dumpster fire, and a full on recession or even depression:
GDP collapses, tax receipts evaporate, deficits gap even wider, and entitlement spending skyrockets (think unemployment benefits), all exacerbating the issue
And then?
GDP collapses, tax receipts evaporate, deficits gap even wider, and entitlement spending skyrockets (think unemployment benefits), all exacerbating the issue
And then?
The money printer is plugged back in, and we get what we call QE Infinity
The Fed prints so much money, that eyeballs bleed
One more cycle of this, and The US Treasury could very well lose its highly coveted status as the global reserve asset
The Fed prints so much money, that eyeballs bleed
One more cycle of this, and The US Treasury could very well lose its highly coveted status as the global reserve asset
So hold on tight, everyone, be selective when adding to risk assets during this uncertainty
As for me, I’m short equity while adding exposures to hard monies like gold, silver, and #Bitcoin, and I'm holding a large percentage of my assets in cash for opportunistic investing
As for me, I’m short equity while adding exposures to hard monies like gold, silver, and #Bitcoin, and I'm holding a large percentage of my assets in cash for opportunistic investing
Because I believe the Fed is going to push us right to the edge
And then, in a showdown worthy of a scene in Butch Cassidy and the Sundance Kid, the Fed and Treasury have a public duel in the town square
The Treasury draws fast and wins this round
But eventually…we all lose.
And then, in a showdown worthy of a scene in Butch Cassidy and the Sundance Kid, the Fed and Treasury have a public duel in the town square
The Treasury draws fast and wins this round
But eventually…we all lose.
This thread is a summary of a recent Informationist Newsletter. If you enjoyed it, make sure to:
1. Follow @jameslavish to see more investment related content
2. Subscribe to The Informationist to learn one simplified concept weekly: jameslavish.substack.com/
1. Follow @jameslavish to see more investment related content
2. Subscribe to The Informationist to learn one simplified concept weekly: jameslavish.substack.com/