Thread
The global balance of payments has to add up (at least in theory).
But it it is still surprising how well the surplus of East Asia and main oil exporters lines up with the deficits of the US and few others --
(excluding the EU actually makes everything line up better)
But it it is still surprising how well the surplus of East Asia and main oil exporters lines up with the deficits of the US and few others --
(excluding the EU actually makes everything line up better)
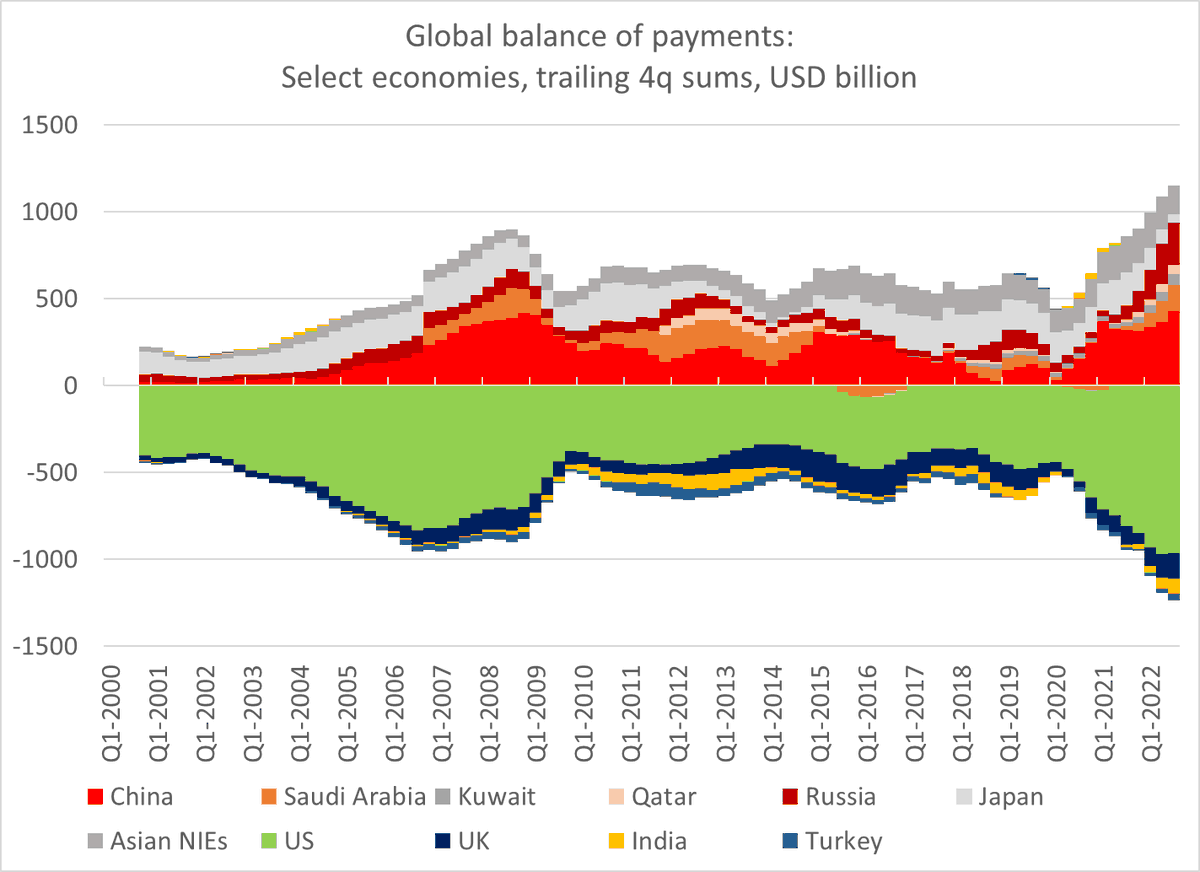
Another way to see the fit -- the same data, with the sign reversed for the main current account deficit economies right now (the US, the UK, India and Turkey) 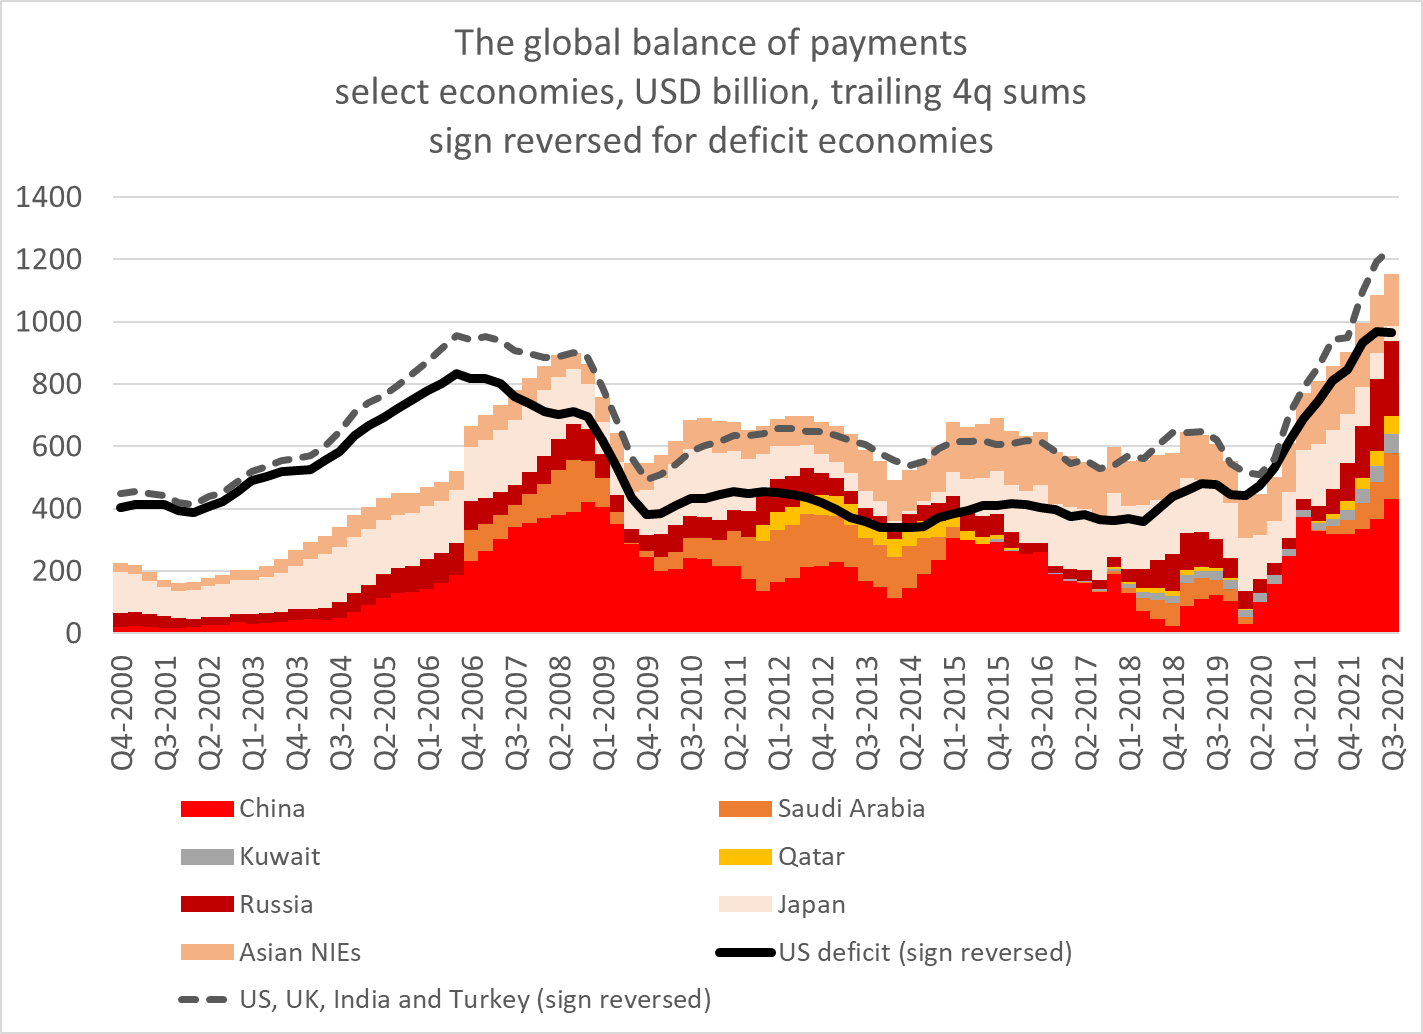

a) obviously this simplifies a bit by focusing on economies outside of the EU with large surpluses/ deficits
b) I have a theory for why everything fits better when the EU and Switzerland are excluded ...
b) I have a theory for why everything fits better when the EU and Switzerland are excluded ...
The theory?
Tax of course. It is no secret that some very large tax driven transactions involving Ireland have, umm, complicated the Euro area's BoP from 2018 to 2021 ... and Switzerland poses similar issues on an ongoing basis.
Tax of course. It is no secret that some very large tax driven transactions involving Ireland have, umm, complicated the Euro area's BoP from 2018 to 2021 ... and Switzerland poses similar issues on an ongoing basis.
Conversely, if Singapore is set aside (a bit one admittedly) the BoP of most of Asia and the big oil exporters is more or less honest -- no big tax driven service imports from the Caymans and Bermuda (i.e. the moon) muck with the numbers.*
* the footnote here is that there are questions about the gap between China customs surplus and its BoP goods surplus (which is now $200b smaller than the customs surplus). but a somewhat larger Chinese surplus in 21 and 22 wouldn't detract from the fit
and to make sure I don't completely bury the lede -- the surplus of the Asia + oil block has doubled since 2020 ...
so there has to be some offsetting adjustments in the global deficit.
so there has to be some offsetting adjustments in the global deficit.