Thread
A picture is worth 1000 words.
A good data visualization is priceless.
Here are 25 charts with stats that re-define the future (and blow your mind):
A good data visualization is priceless.
Here are 25 charts with stats that re-define the future (and blow your mind):
1/ A 15-minute daily commute equals 5 days per year on the road.
If it's 45 minutes, you're spending 15.6 days per year commuting.
Solution: Self-driving cars, virtual offices?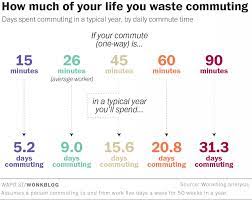
If it's 45 minutes, you're spending 15.6 days per year commuting.
Solution: Self-driving cars, virtual offices?

2/ Here's how we spend our time.
A huge chunk goes to sleeping—that's necessary and healthy.
Do we need robots to take over the housework?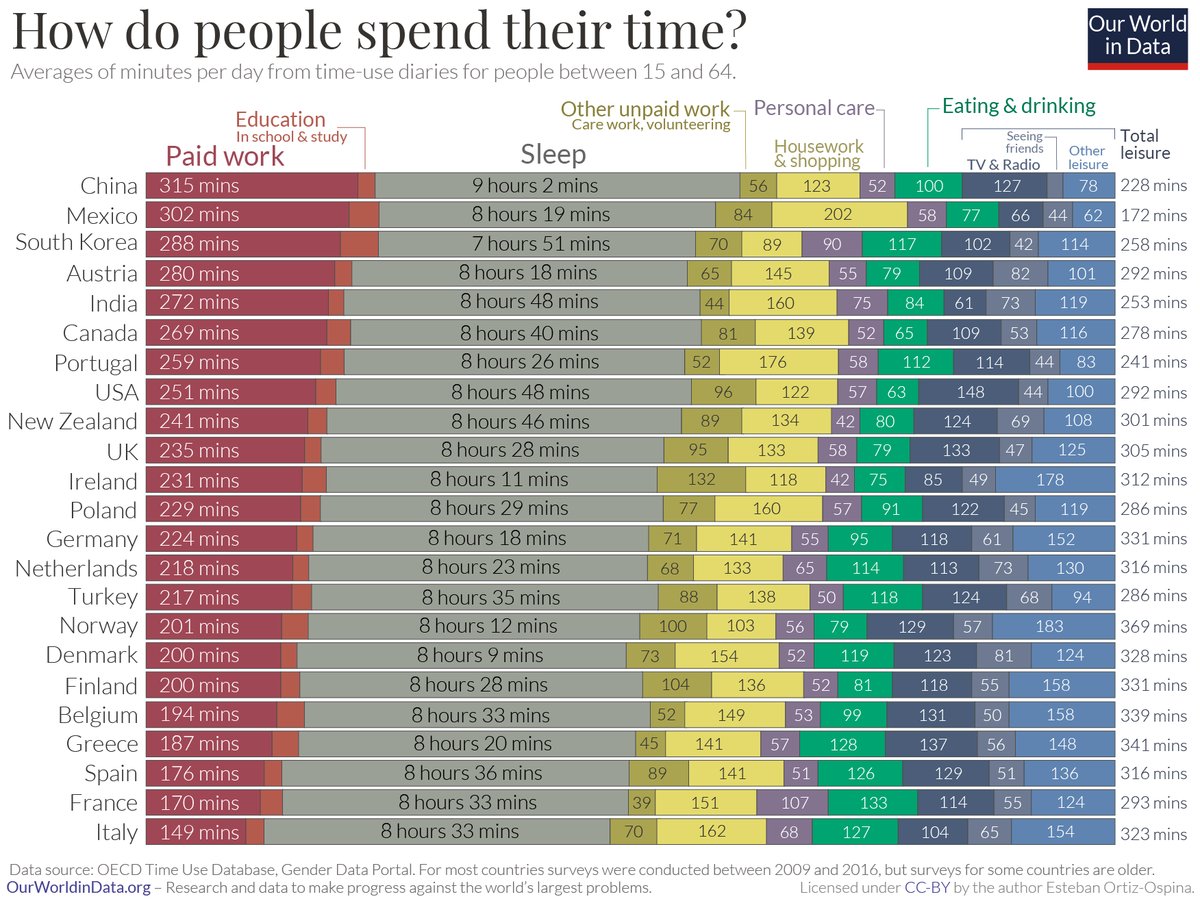
A huge chunk goes to sleeping—that's necessary and healthy.
Do we need robots to take over the housework?

3/ In November, the global population reached 8 billion.
Total numbers are still increasing but the growth rate is dropping.
By 2100, the growth rate will have plummeted from a high of 2.1% in 1968 to 0.1%.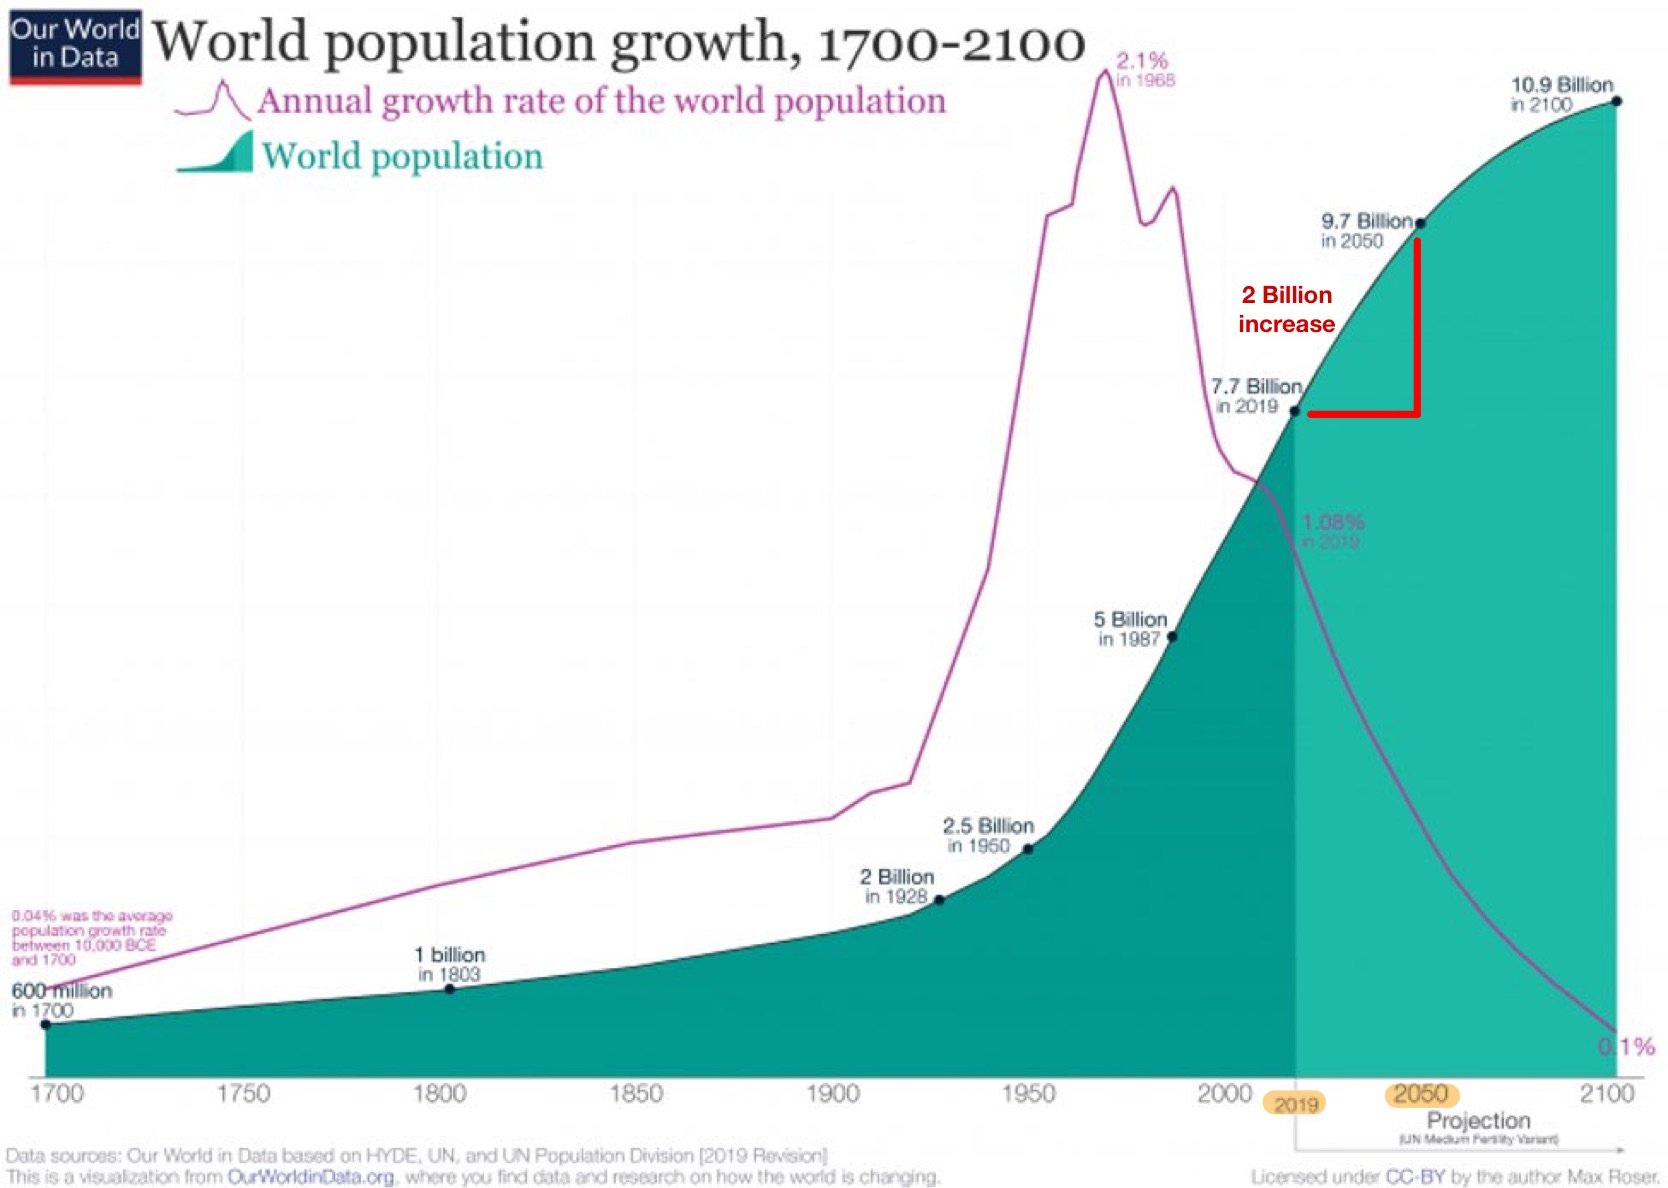
Total numbers are still increasing but the growth rate is dropping.
By 2100, the growth rate will have plummeted from a high of 2.1% in 1968 to 0.1%.

4/ By 2050, global birth and death rates will be very close.
Death rates 9.9 per 1000.
Birth rates 14.4 per 1000.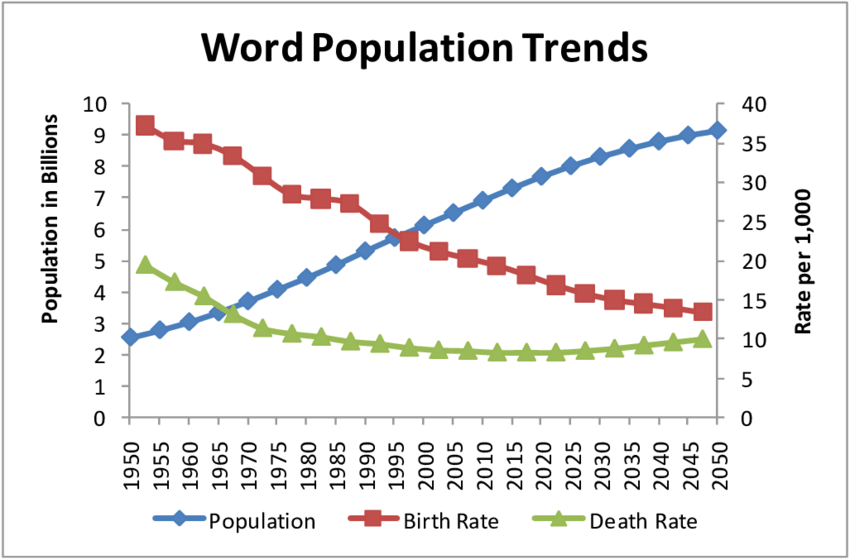
Death rates 9.9 per 1000.
Birth rates 14.4 per 1000.

5/ By 2100, India will be the most populous nation at 1.09B, but its numbers will be declining.
Nigeria's will rise into second place with an increase from 206M in 2017 to 791M.
Japan's will drop from 128M to 60M.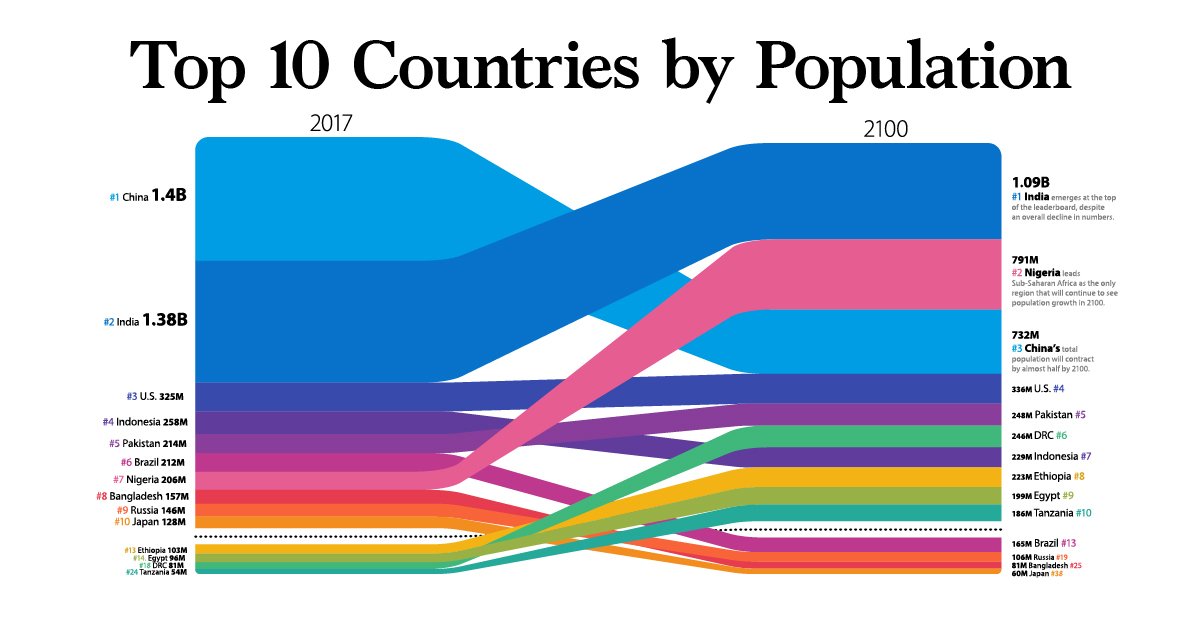
Nigeria's will rise into second place with an increase from 206M in 2017 to 791M.
Japan's will drop from 128M to 60M.

6/ Poverty has been declining, globally.
Still a long way to go, but overall, living conditions are improving.
The poverty gap decreased from $500 billion in the 1980s to under $200 billion in the 2020s.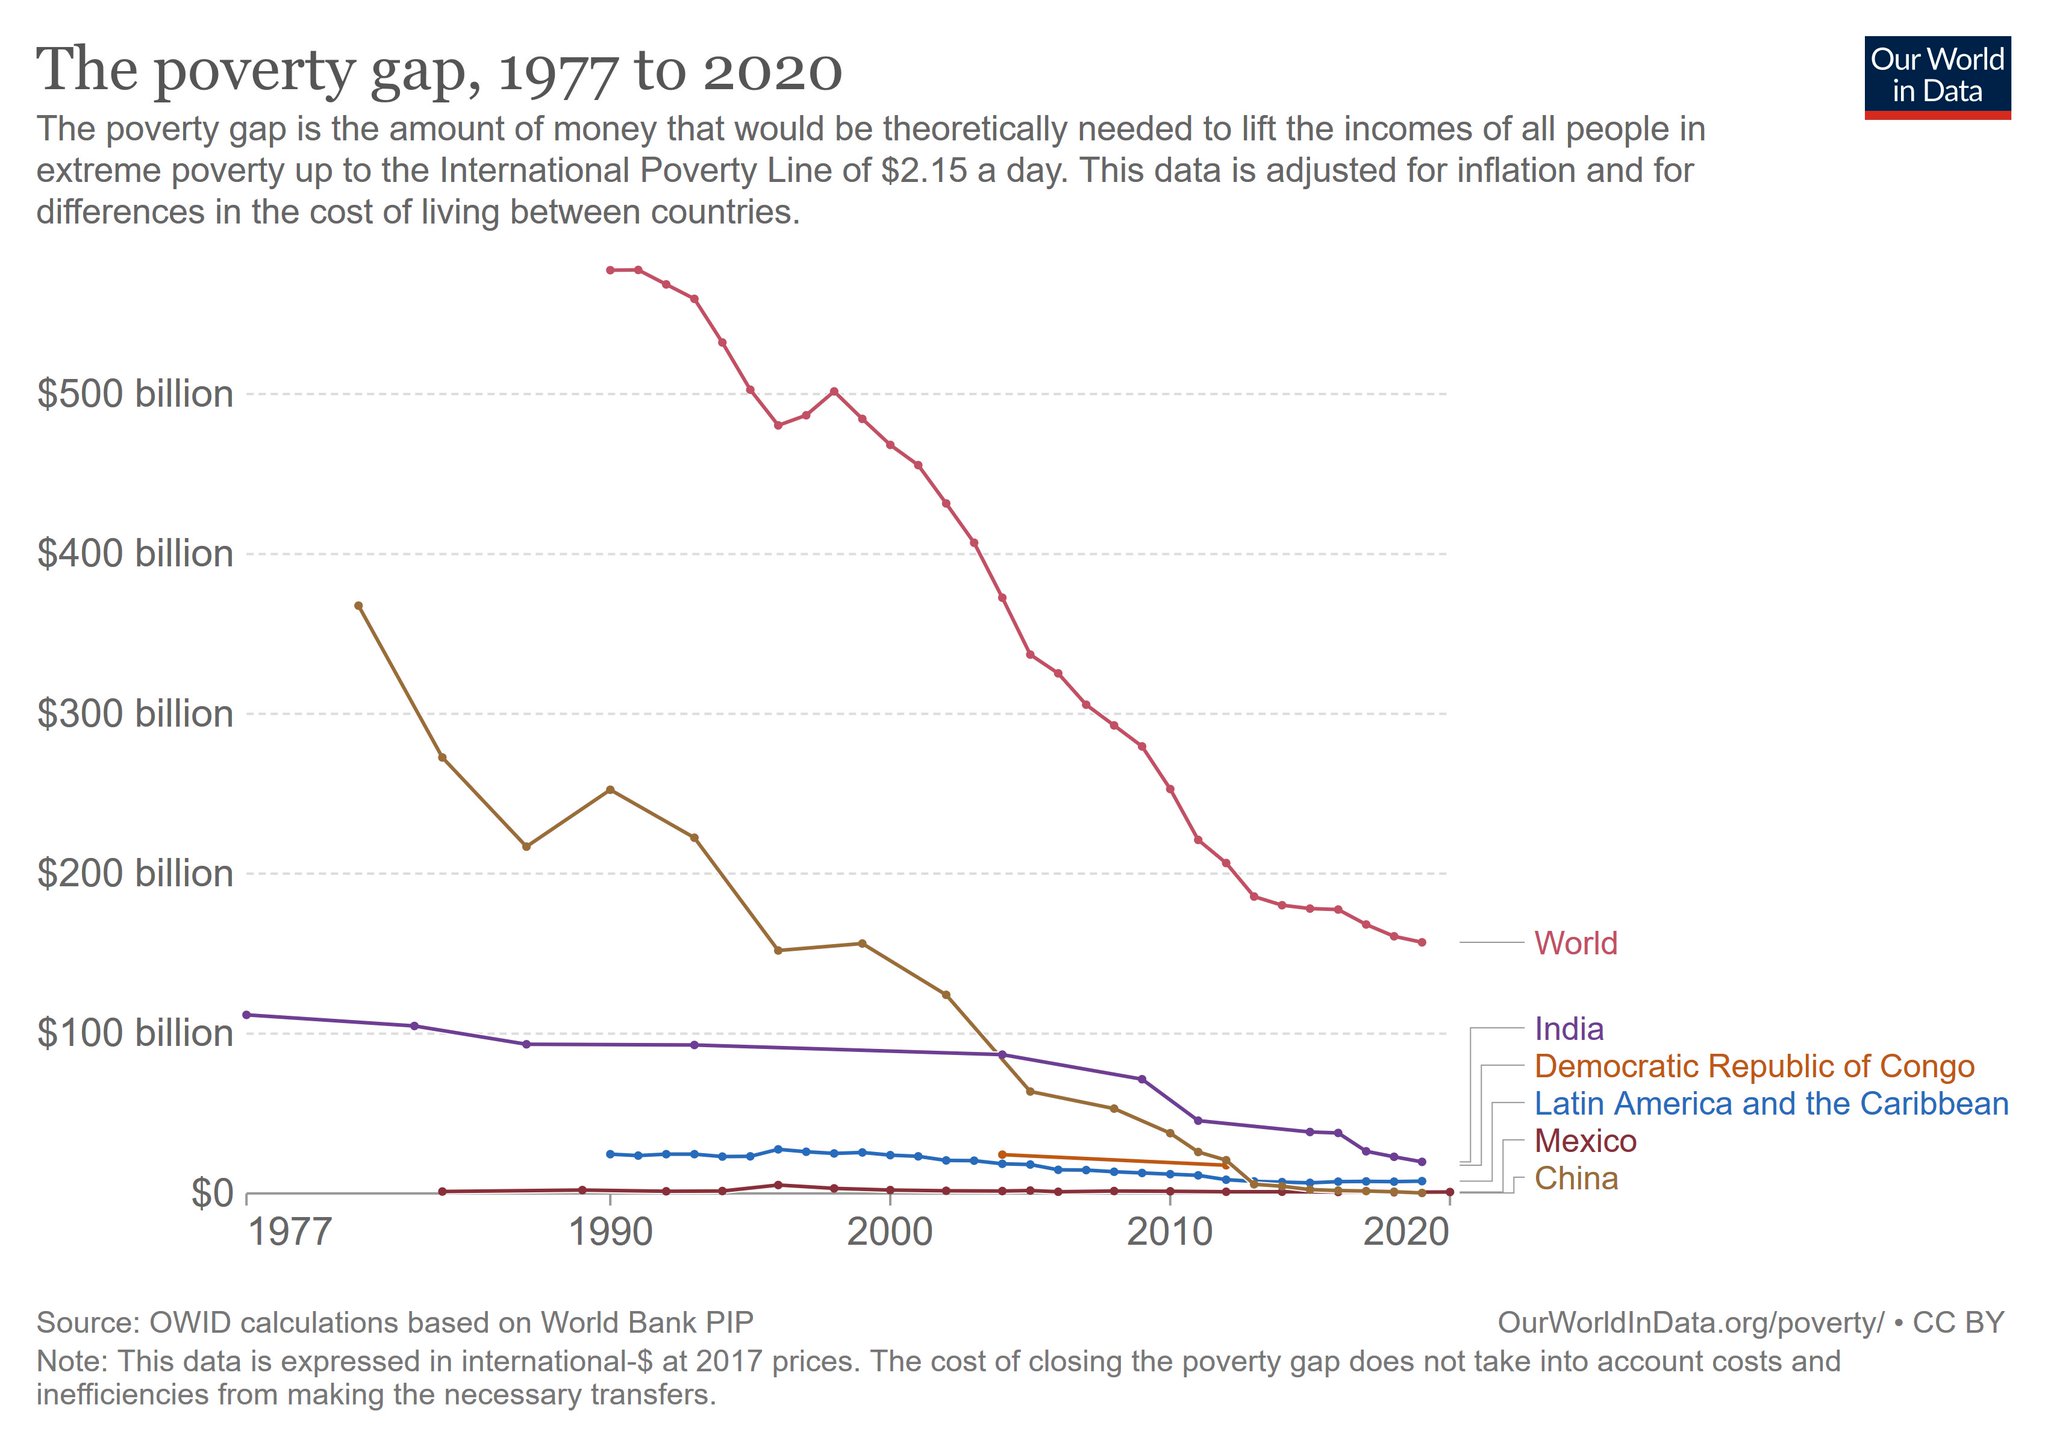
Still a long way to go, but overall, living conditions are improving.
The poverty gap decreased from $500 billion in the 1980s to under $200 billion in the 2020s.

7/ Asset distribution across net worth tiers is eye-opening.
Primary residences are the most important asset class for net worth tiers up to $1M.
Multi-millionaires or billionaires have most of their wealth in stock & business interests.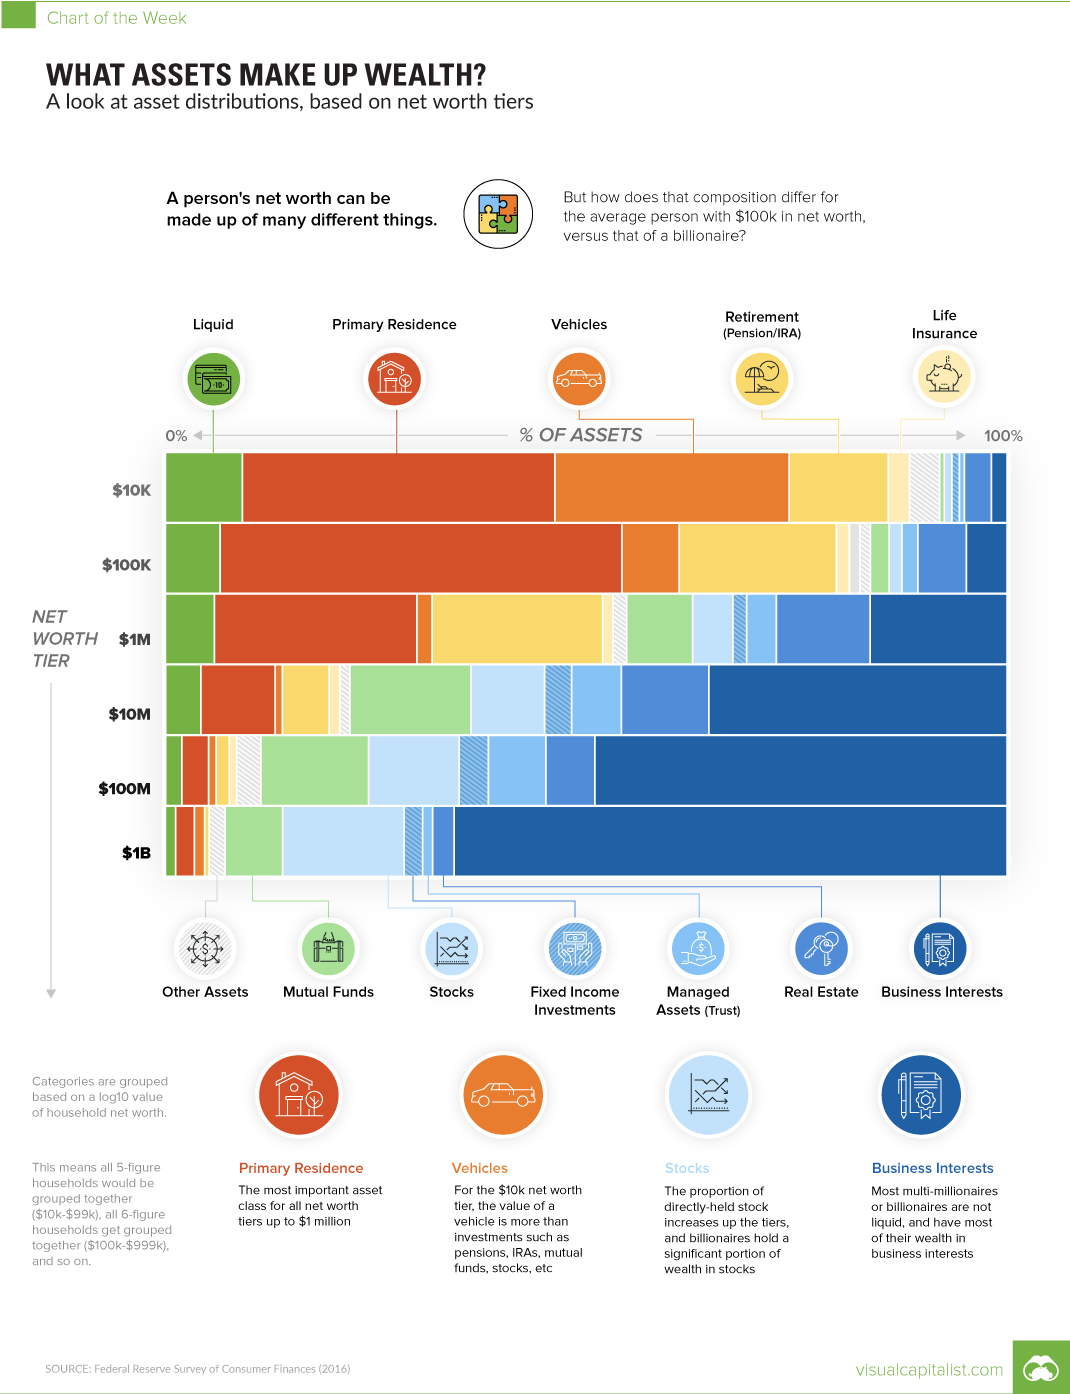
Primary residences are the most important asset class for net worth tiers up to $1M.
Multi-millionaires or billionaires have most of their wealth in stock & business interests.

8/ Soon, most rich consumers will be non-westerners.
There will be a huge shift in global buying power after 2027.
By 2040, global manufacturing will adjust significantly to meet new demands and different tastes.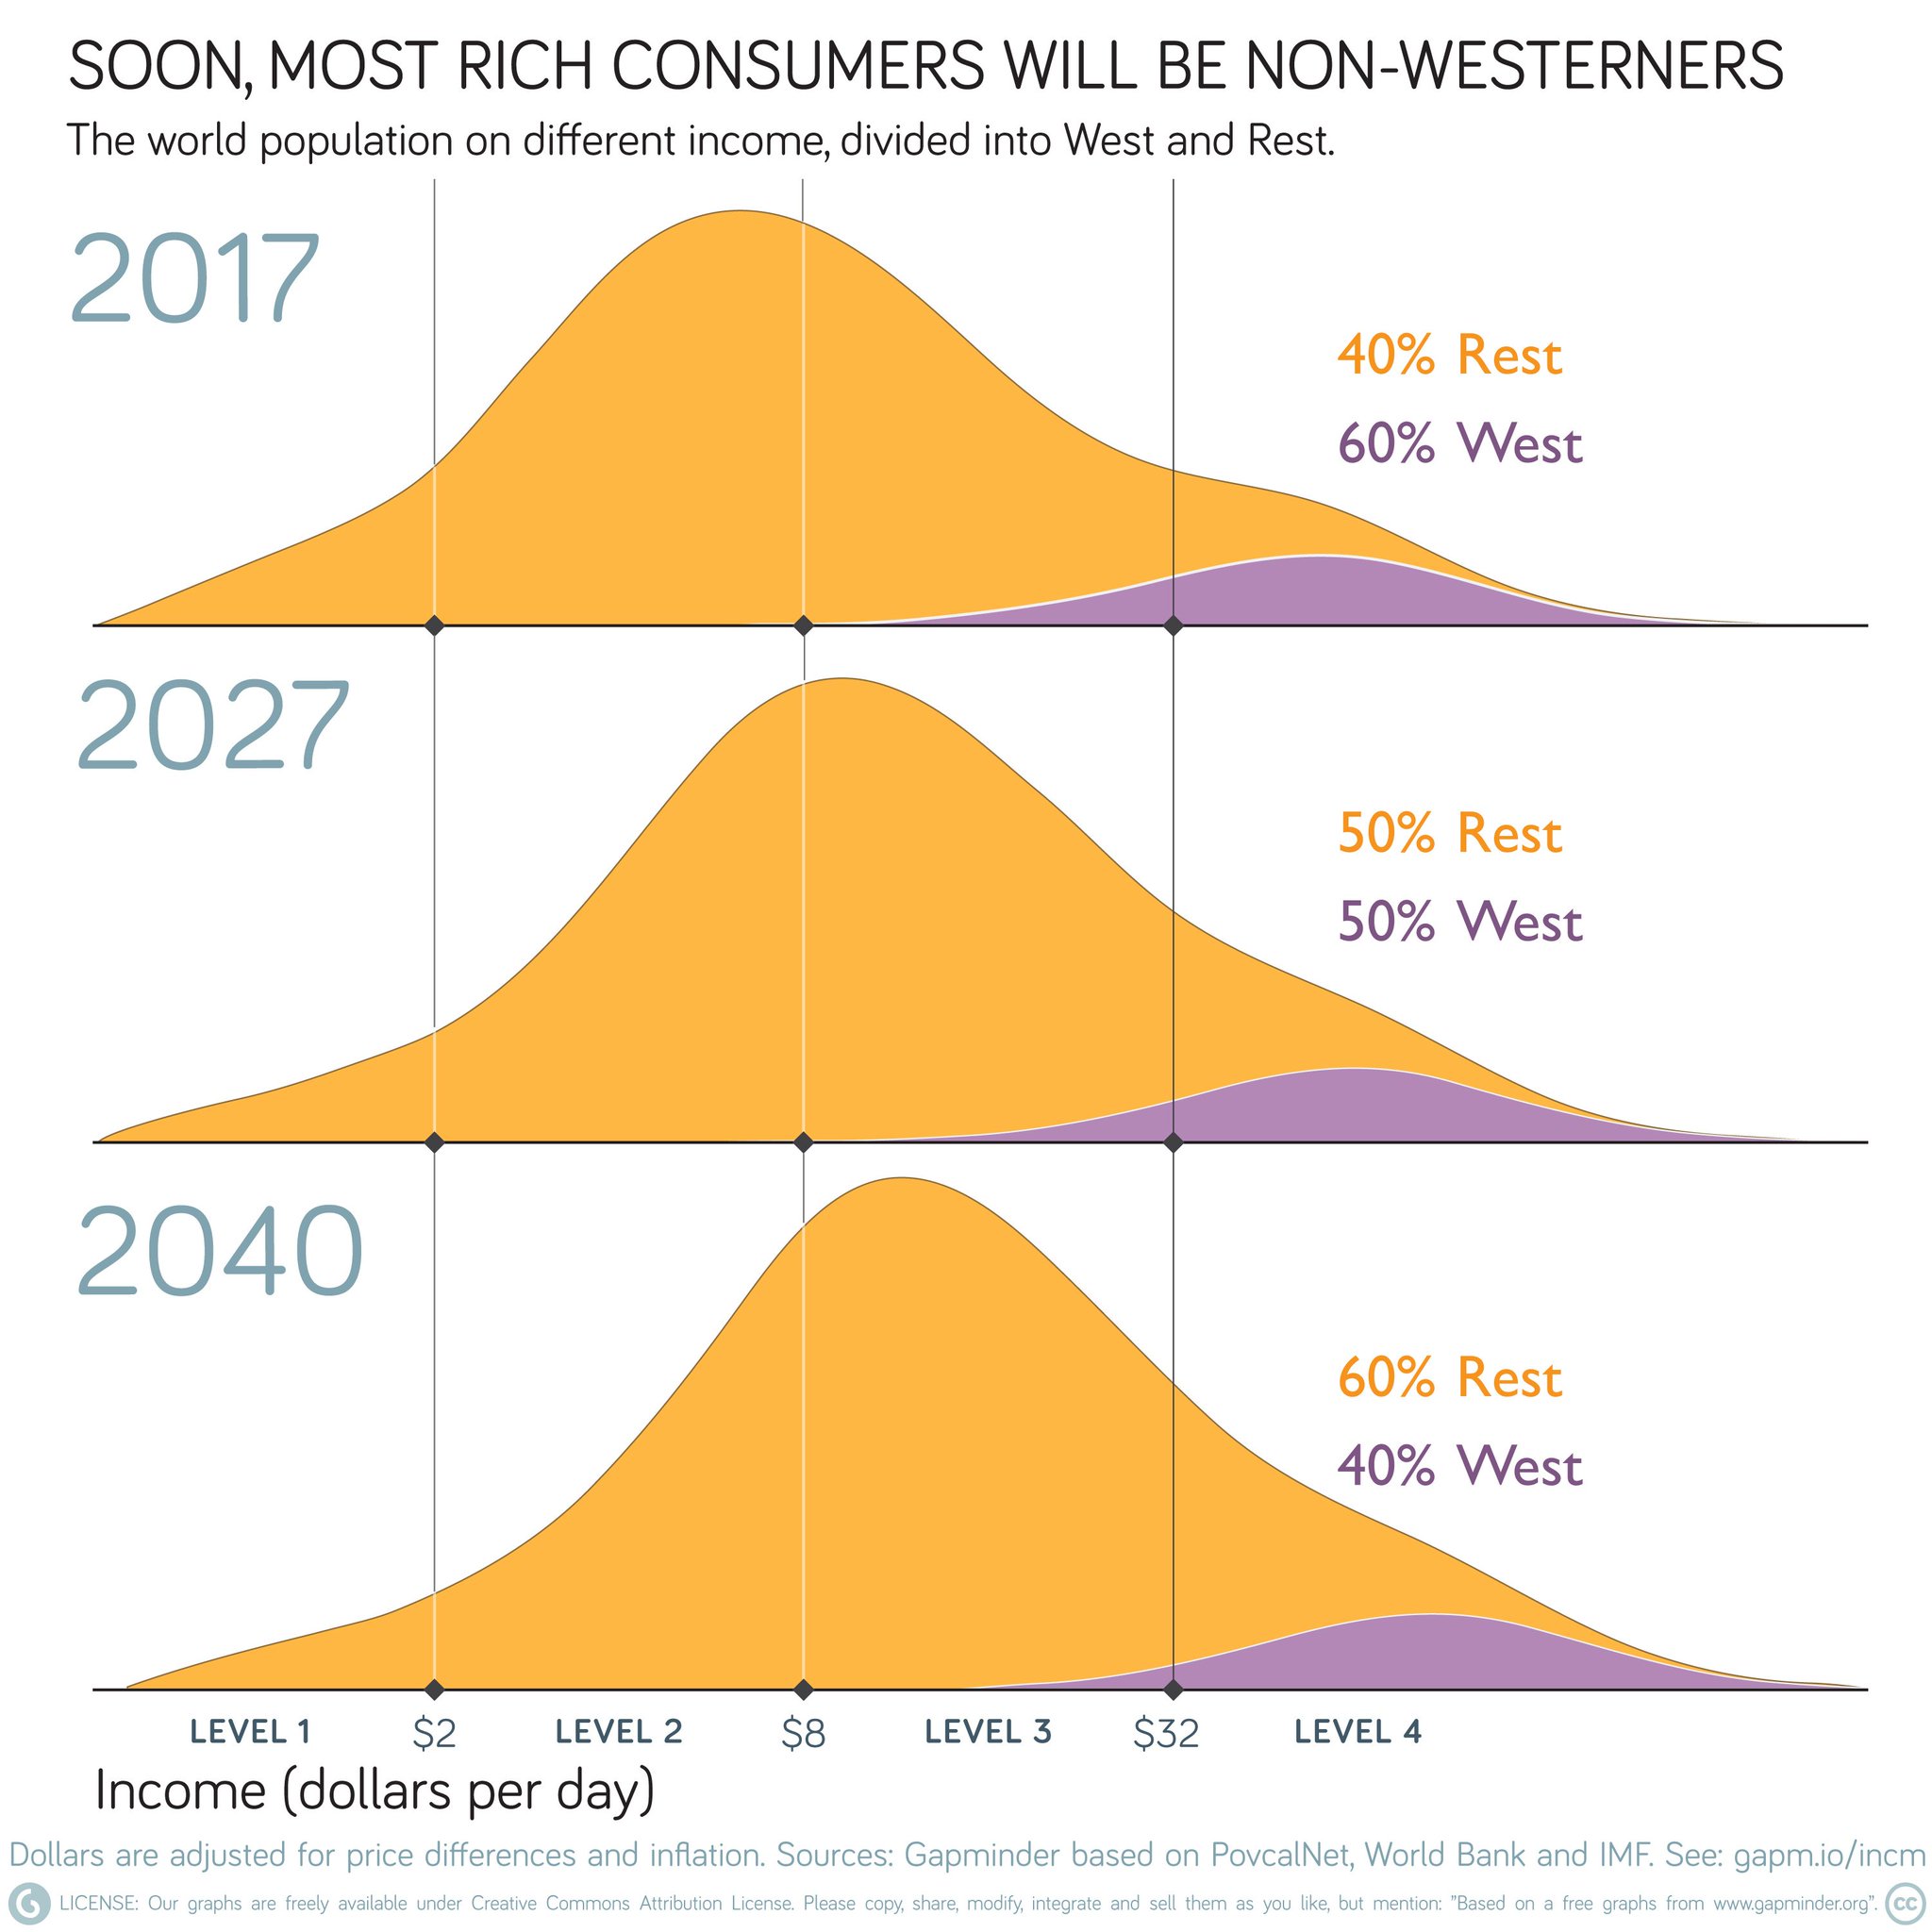
There will be a huge shift in global buying power after 2027.
By 2040, global manufacturing will adjust significantly to meet new demands and different tastes.

9/ In 2022, the human genome was finally completely sequenced.
The Human Genome Project claimed victory in 2001, when it had read almost all of a person's DNA.
But the remaining 8 percent of the genome took another two decades to decipher.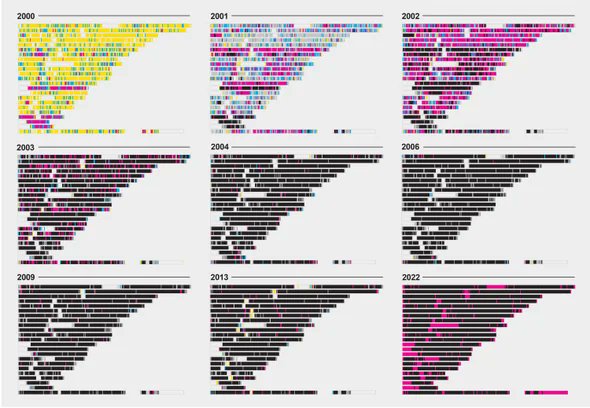
The Human Genome Project claimed victory in 2001, when it had read almost all of a person's DNA.
But the remaining 8 percent of the genome took another two decades to decipher.

10/ The cost to sequence your DNA has dropped from:
$95M in 2001 to less than $450 in 2020.
Expect an explosion in bespoke medicine tailored to individual needs.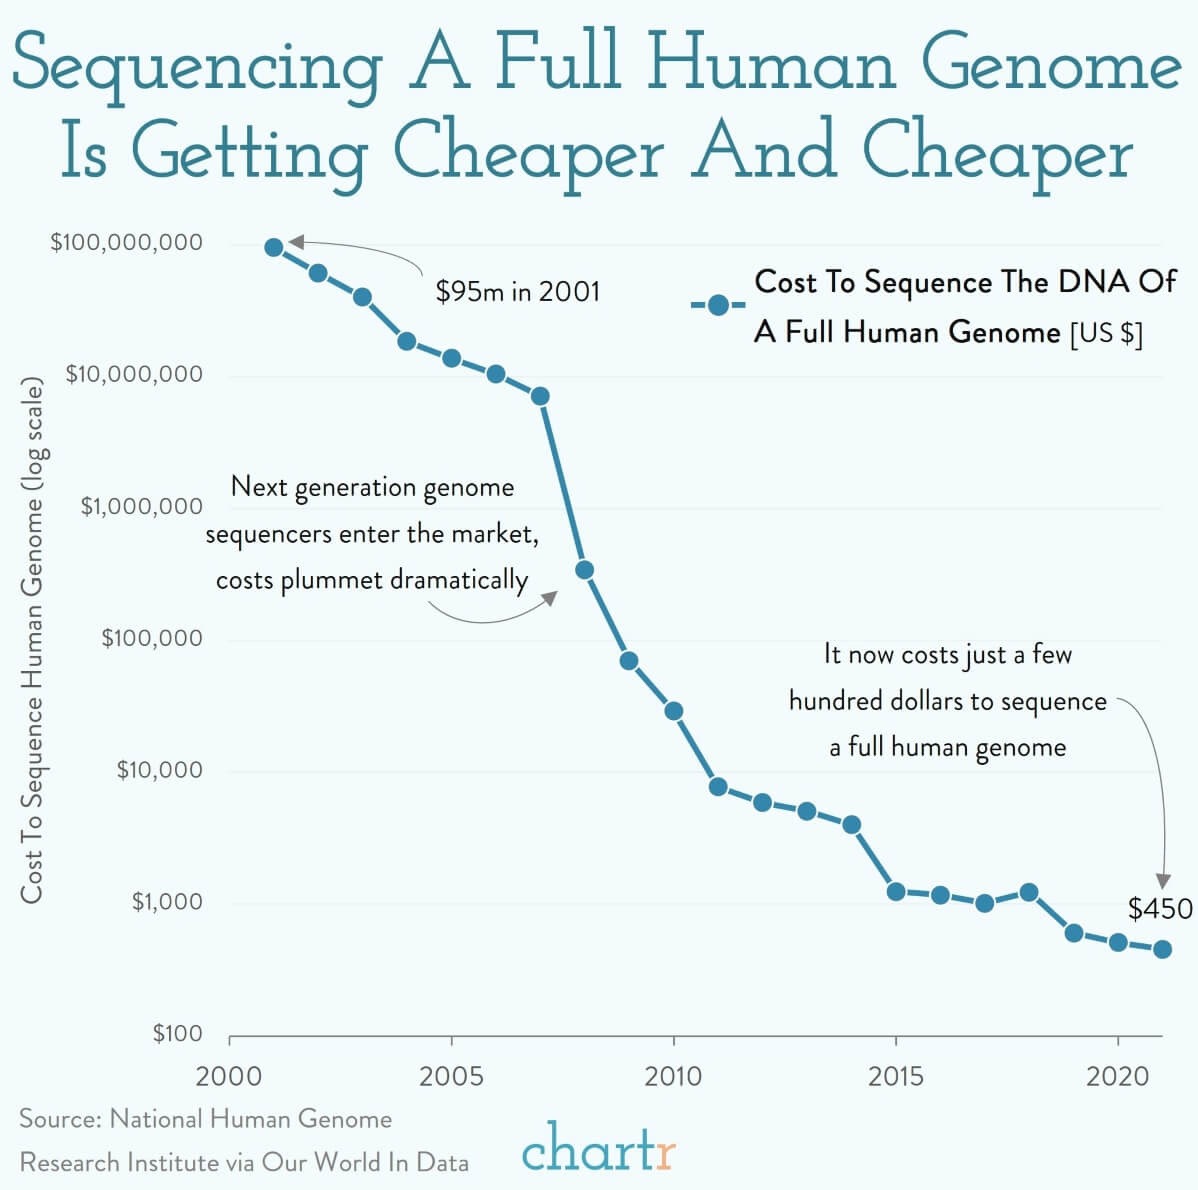
$95M in 2001 to less than $450 in 2020.
Expect an explosion in bespoke medicine tailored to individual needs.

11/ In 2021, nearly one-third of American had no sex in the past year. 

12/ Lack of sex is driven mainly by the young. 

13/ Perhaps it's because they're online. 

14/ We know the planet is heating up, but this brings it home.
Here are the monthly global mean temperatures from 1851 to 2020.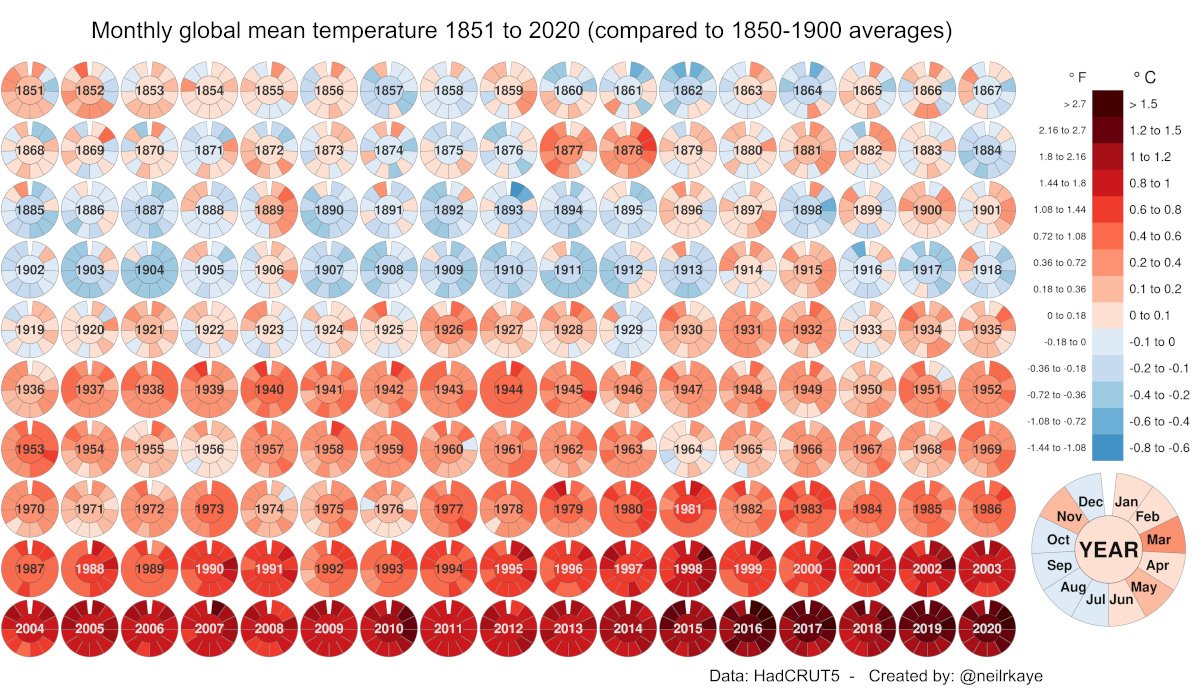
Here are the monthly global mean temperatures from 1851 to 2020.

15/ Here's how global energy consumption evolved from 1800 to 2020.
Coal, oil and gas are the primary sources.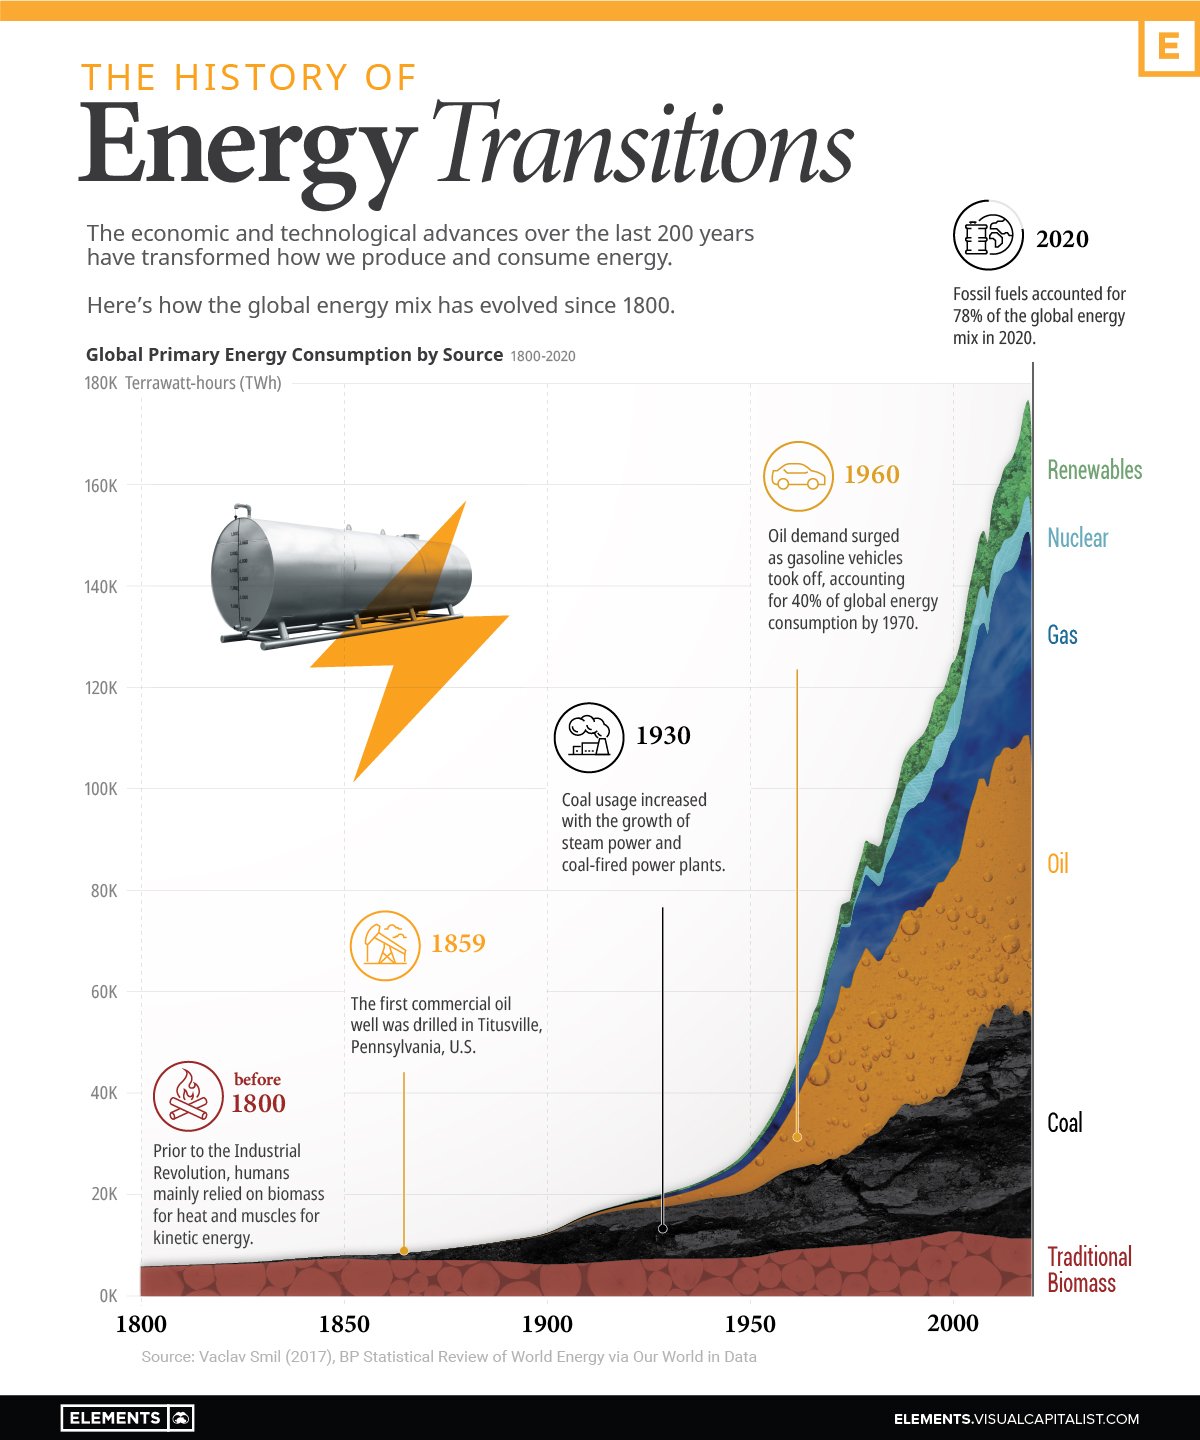
Coal, oil and gas are the primary sources.

16/ A 100% renewable energy future is possible.
Here's a roadmap from Stanford University's Mark Jacobson and 26 colleagues
139 countries can be entirely powered by wind, water, and sunlight by 2050.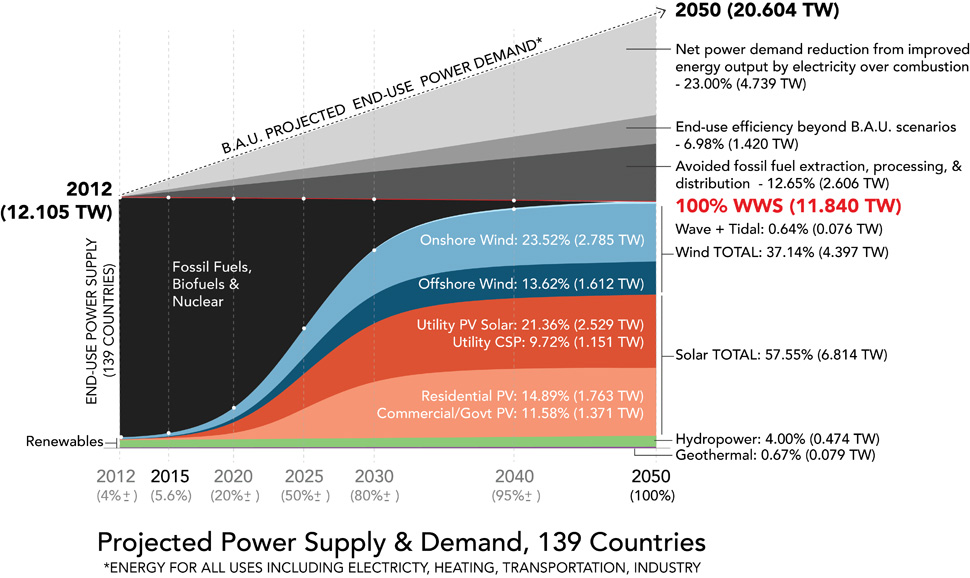
Here's a roadmap from Stanford University's Mark Jacobson and 26 colleagues
139 countries can be entirely powered by wind, water, and sunlight by 2050.

17/ The price of computation today is roughly one hundred-millionth what it was in the 1970s.
A megabyte of data storage in 1956 would have cost around $9,200 ($85,000 in today’s prices).
It now costs just $0.00002.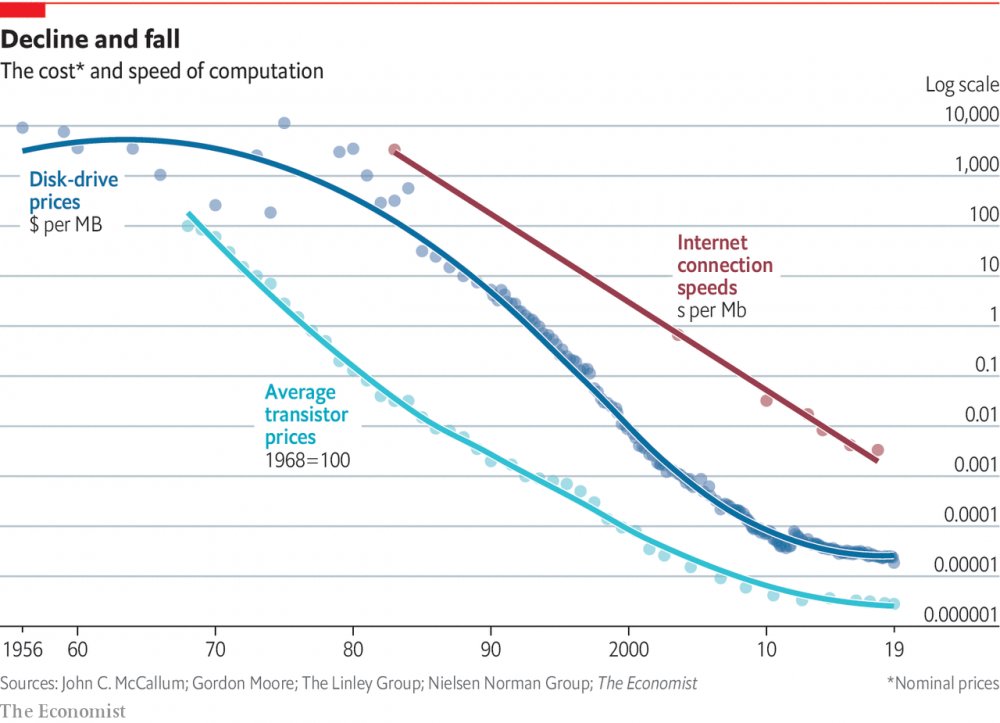
A megabyte of data storage in 1956 would have cost around $9,200 ($85,000 in today’s prices).
It now costs just $0.00002.

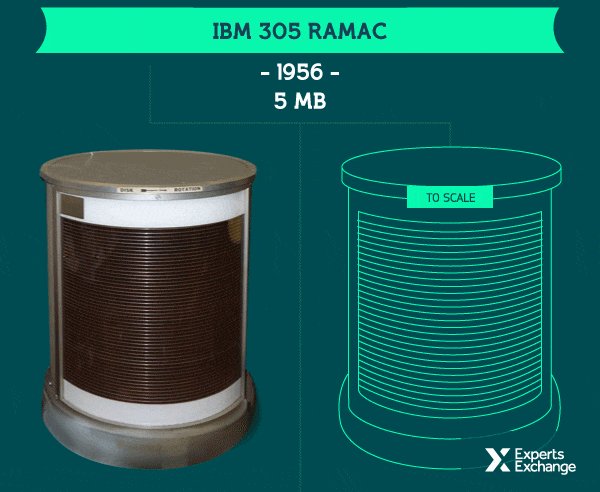
18/ In the 1970s, data storage equipment was serious business.
The IBM 305 RAMAC weighed a ton and measured 16 square feet and stored just 5MB.
The animation below visualizes just how compact terabytes of storage have become.
The IBM 305 RAMAC weighed a ton and measured 16 square feet and stored just 5MB.
The animation below visualizes just how compact terabytes of storage have become.
19/ Seems like the explosion of AI apps in the last few months came out of nowhere.
But it's all been in the works for decades.
In 2020 - 2021, there were over 140,000 AI patents, globally.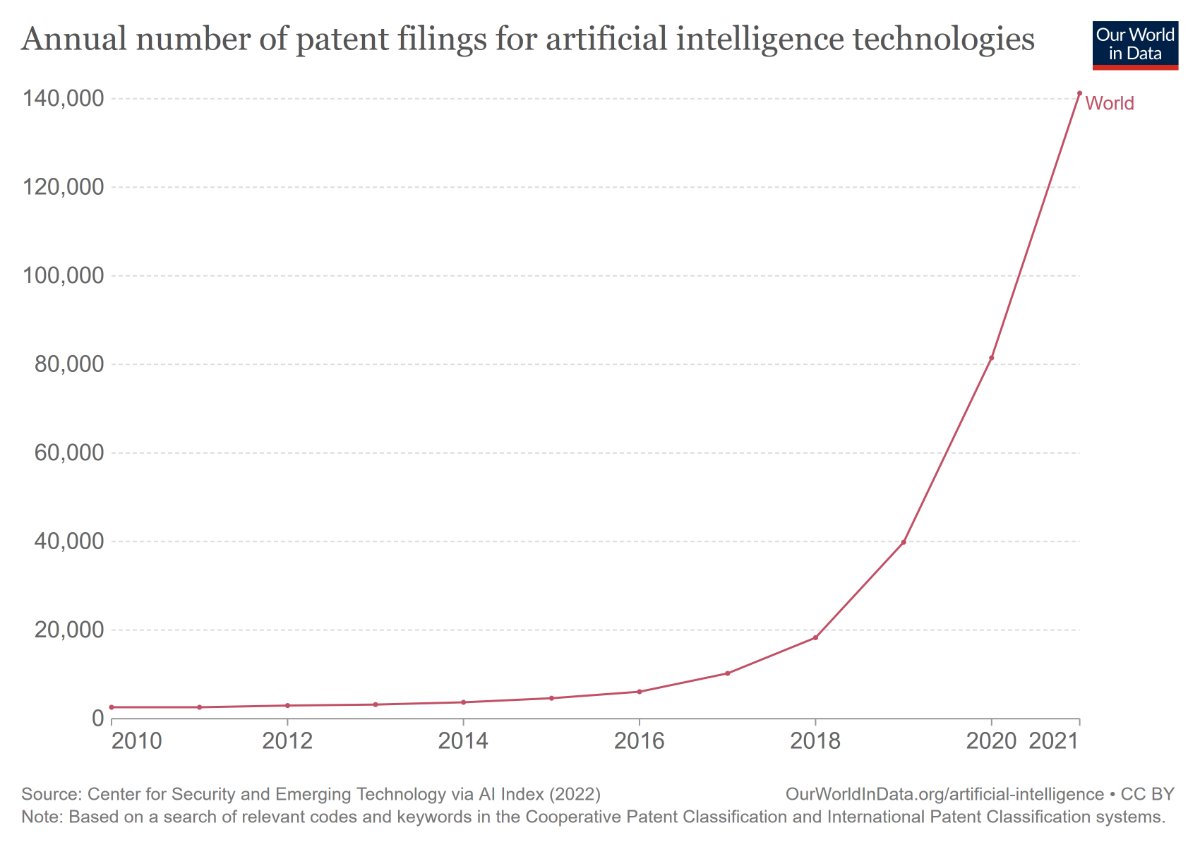
But it's all been in the works for decades.
In 2020 - 2021, there were over 140,000 AI patents, globally.

20/ During the past ten years, the computing resources devoted to AI training models have exploded.
After doubling every two years from 1960 to 2010, AI compute complexity has soared 10x every year.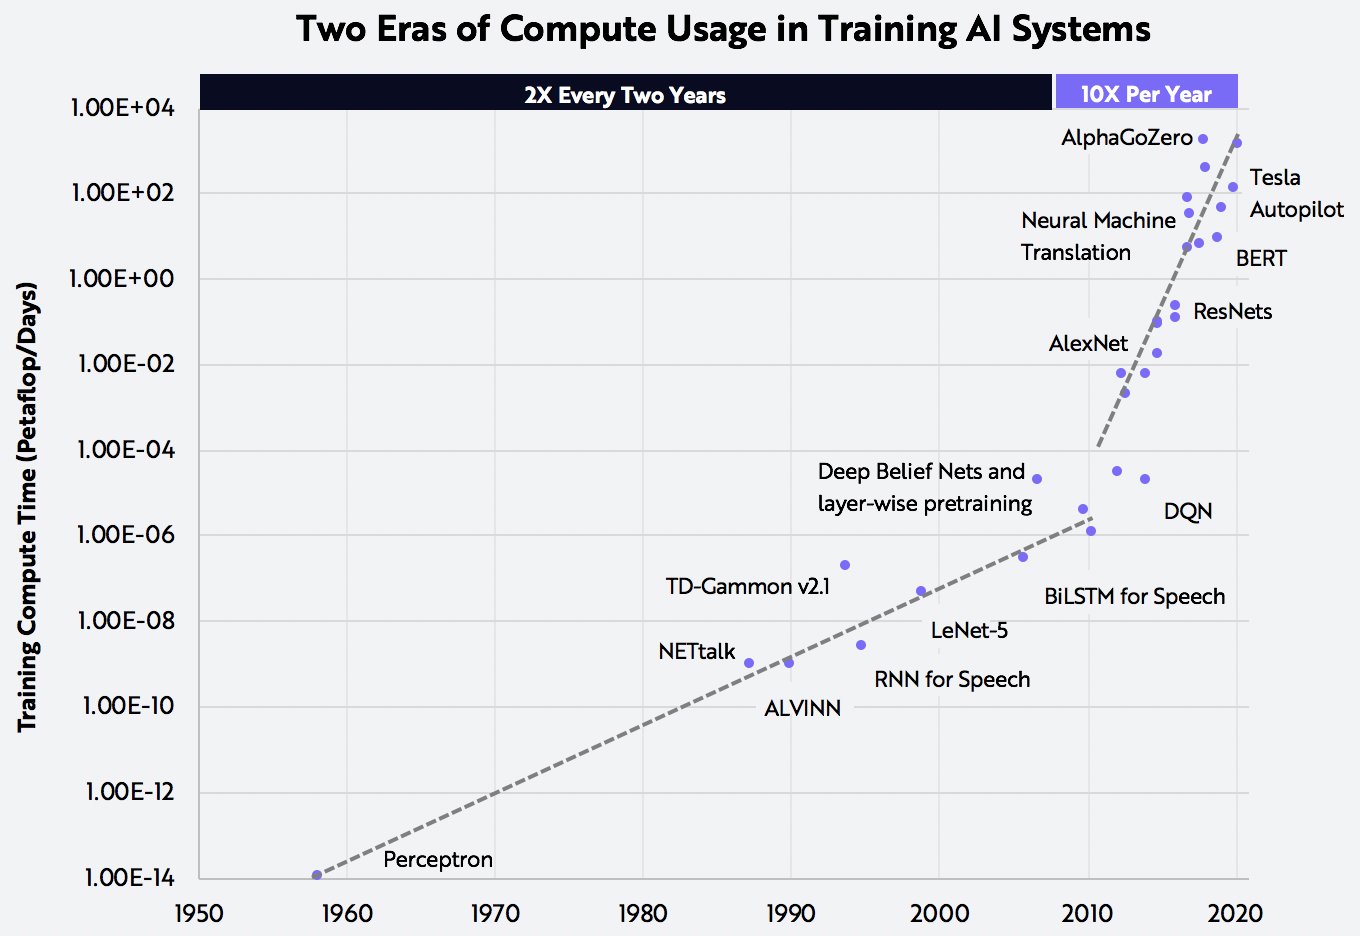
After doubling every two years from 1960 to 2010, AI compute complexity has soared 10x every year.

21/ Just as important, AI training costs have dropped roughly 10x every year.
In 2017, the cost to train an image recognition network like ResNet-50 was $1,000.
Now it's less than $1.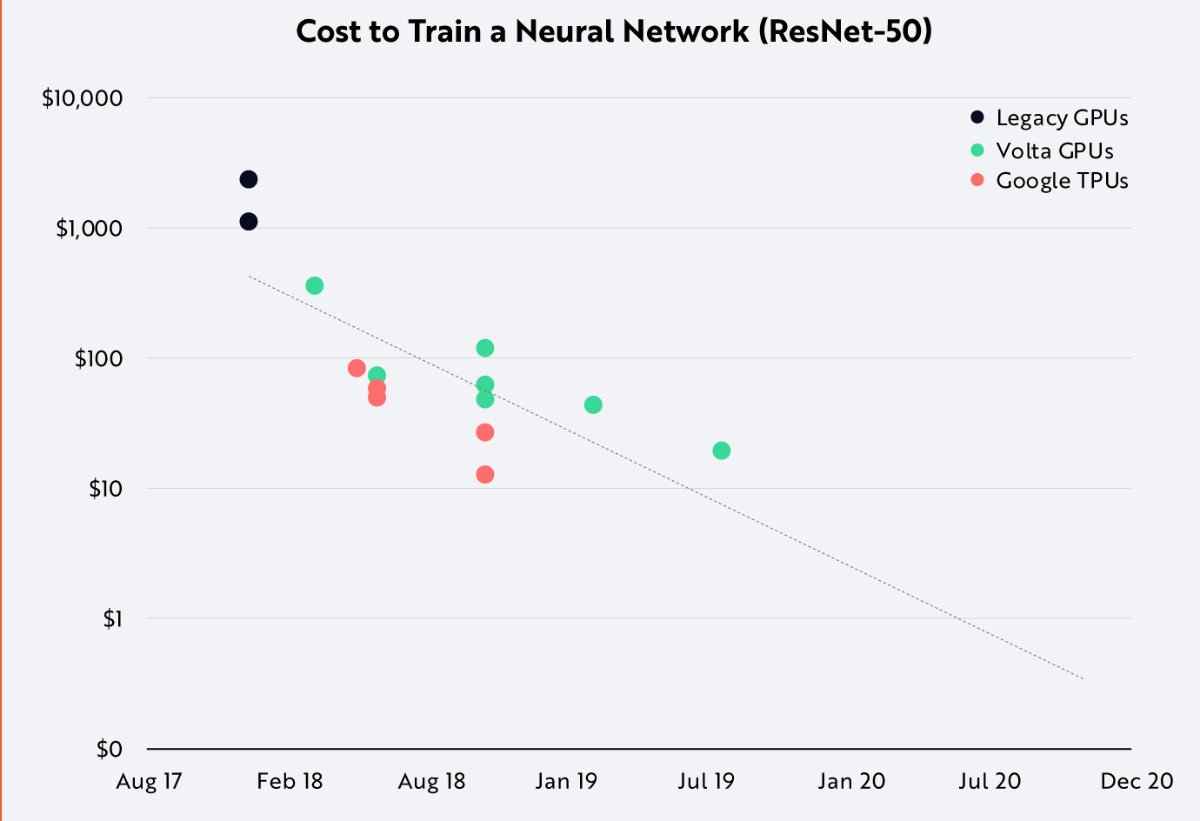
In 2017, the cost to train an image recognition network like ResNet-50 was $1,000.
Now it's less than $1.

22/ To understand crypto and web3 cycles you need to look at the internet in the 1990/2000s.
The dotcom crash birthed some of the top tech products of the 21st century.
Expect something similar with web3.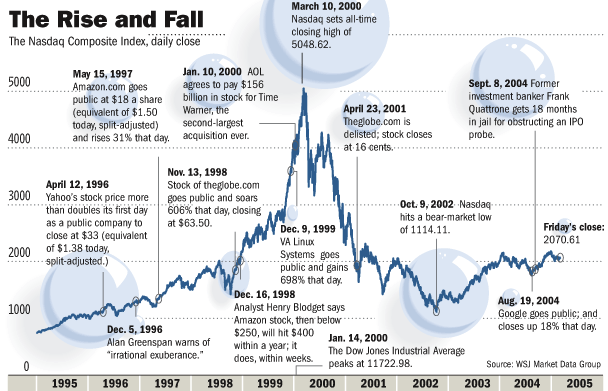
The dotcom crash birthed some of the top tech products of the 21st century.
Expect something similar with web3.

23/ Here's why: 

24/ And this: 

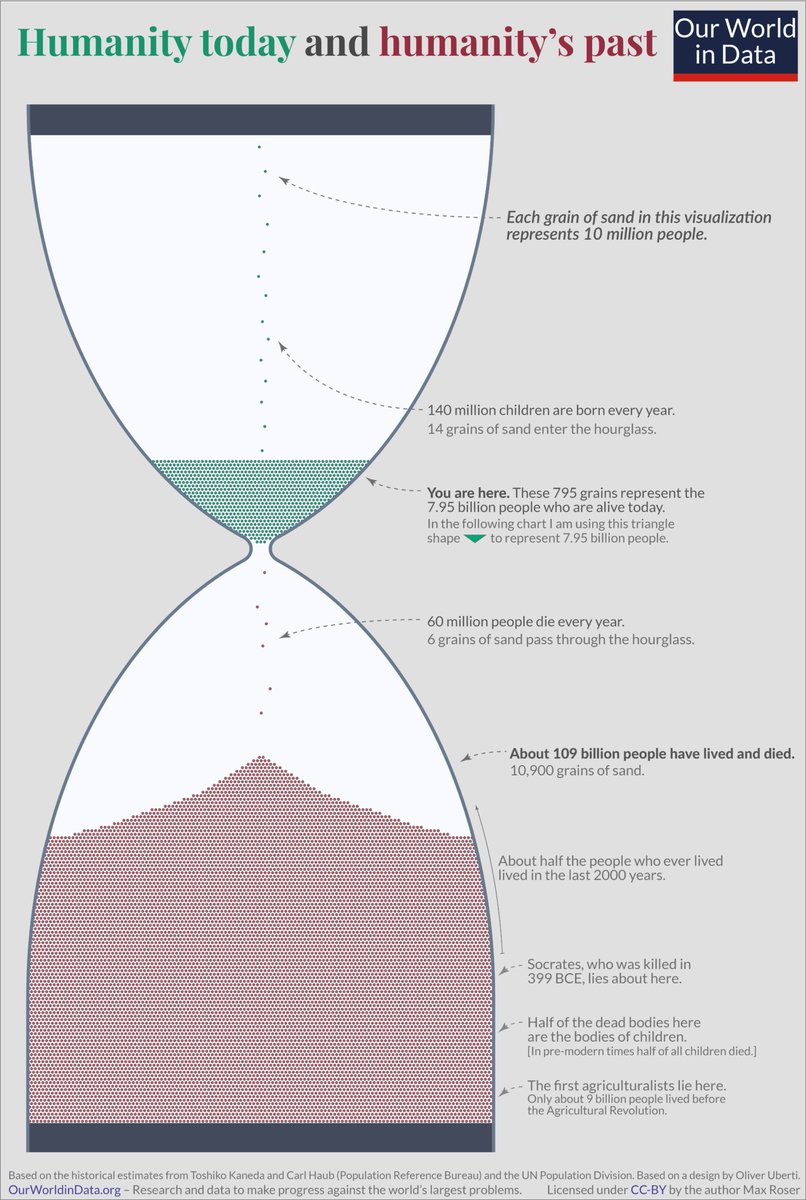
25/ Humanity today and humanity's past.
117 billion humans have been born since the dawn of modern humankind.
This means that those of us who are alive now represent about 6.8% of all people who ever lived.
117 billion humans have been born since the dawn of modern humankind.
This means that those of us who are alive now represent about 6.8% of all people who ever lived.
26/ Finally, I asked Chat-GPT:
"Why is data visualization so powerful?"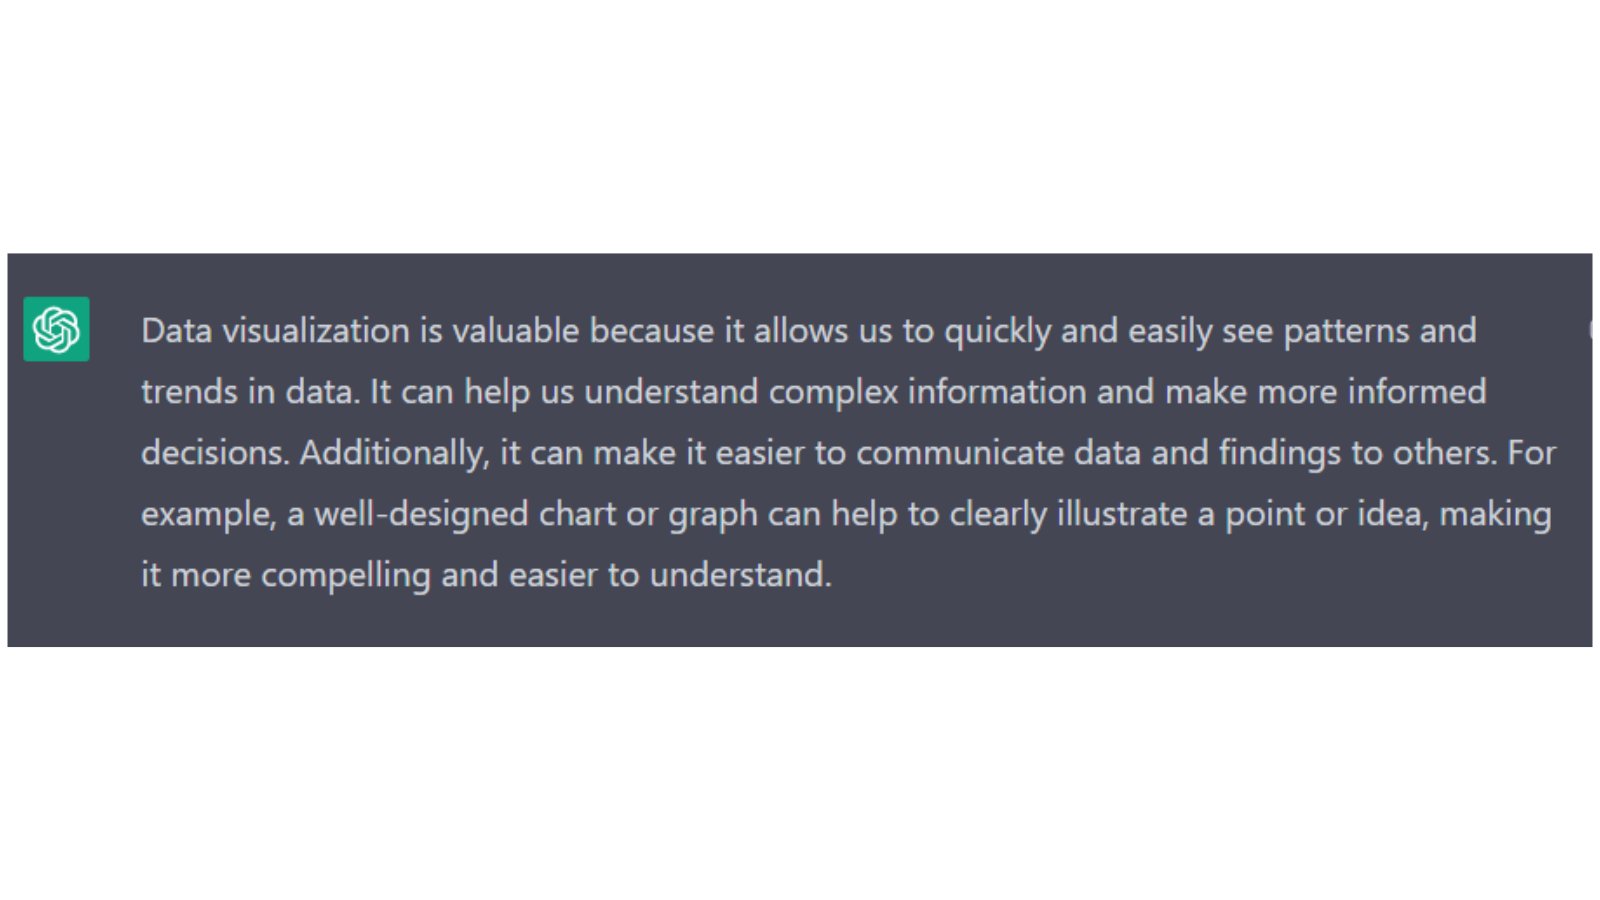
"Why is data visualization so powerful?"

That's it, folks. I hope this was useful.
If you enjoyed it, please share by retweeting the first tweet.
I write about the ideas, technology and people shaping web3 and the future.
You can follow me @MishadaVinci.
If you enjoyed it, please share by retweeting the first tweet.
I write about the ideas, technology and people shaping web3 and the future.
You can follow me @MishadaVinci.
My Future of the World newsletter drops twice weekly.
It's the perfect newsletter if you want to keep up with future trends.
You can check out the latest posts and subscribe here 👇
mishadavinci.substack.com/p/make-ai-work-for-you-the-easy-nft
It's the perfect newsletter if you want to keep up with future trends.
You can check out the latest posts and subscribe here 👇
mishadavinci.substack.com/p/make-ai-work-for-you-the-easy-nft