Thread
1/
Get a cup of coffee.
In this thread, I'll walk you through 2 key portfolio diversification principles:
(i) Minimizing correlations, and
(ii) Re-balancing intelligently.
You don't need Markowitz's portfolio theory or the Kelly Criterion to understand these concepts.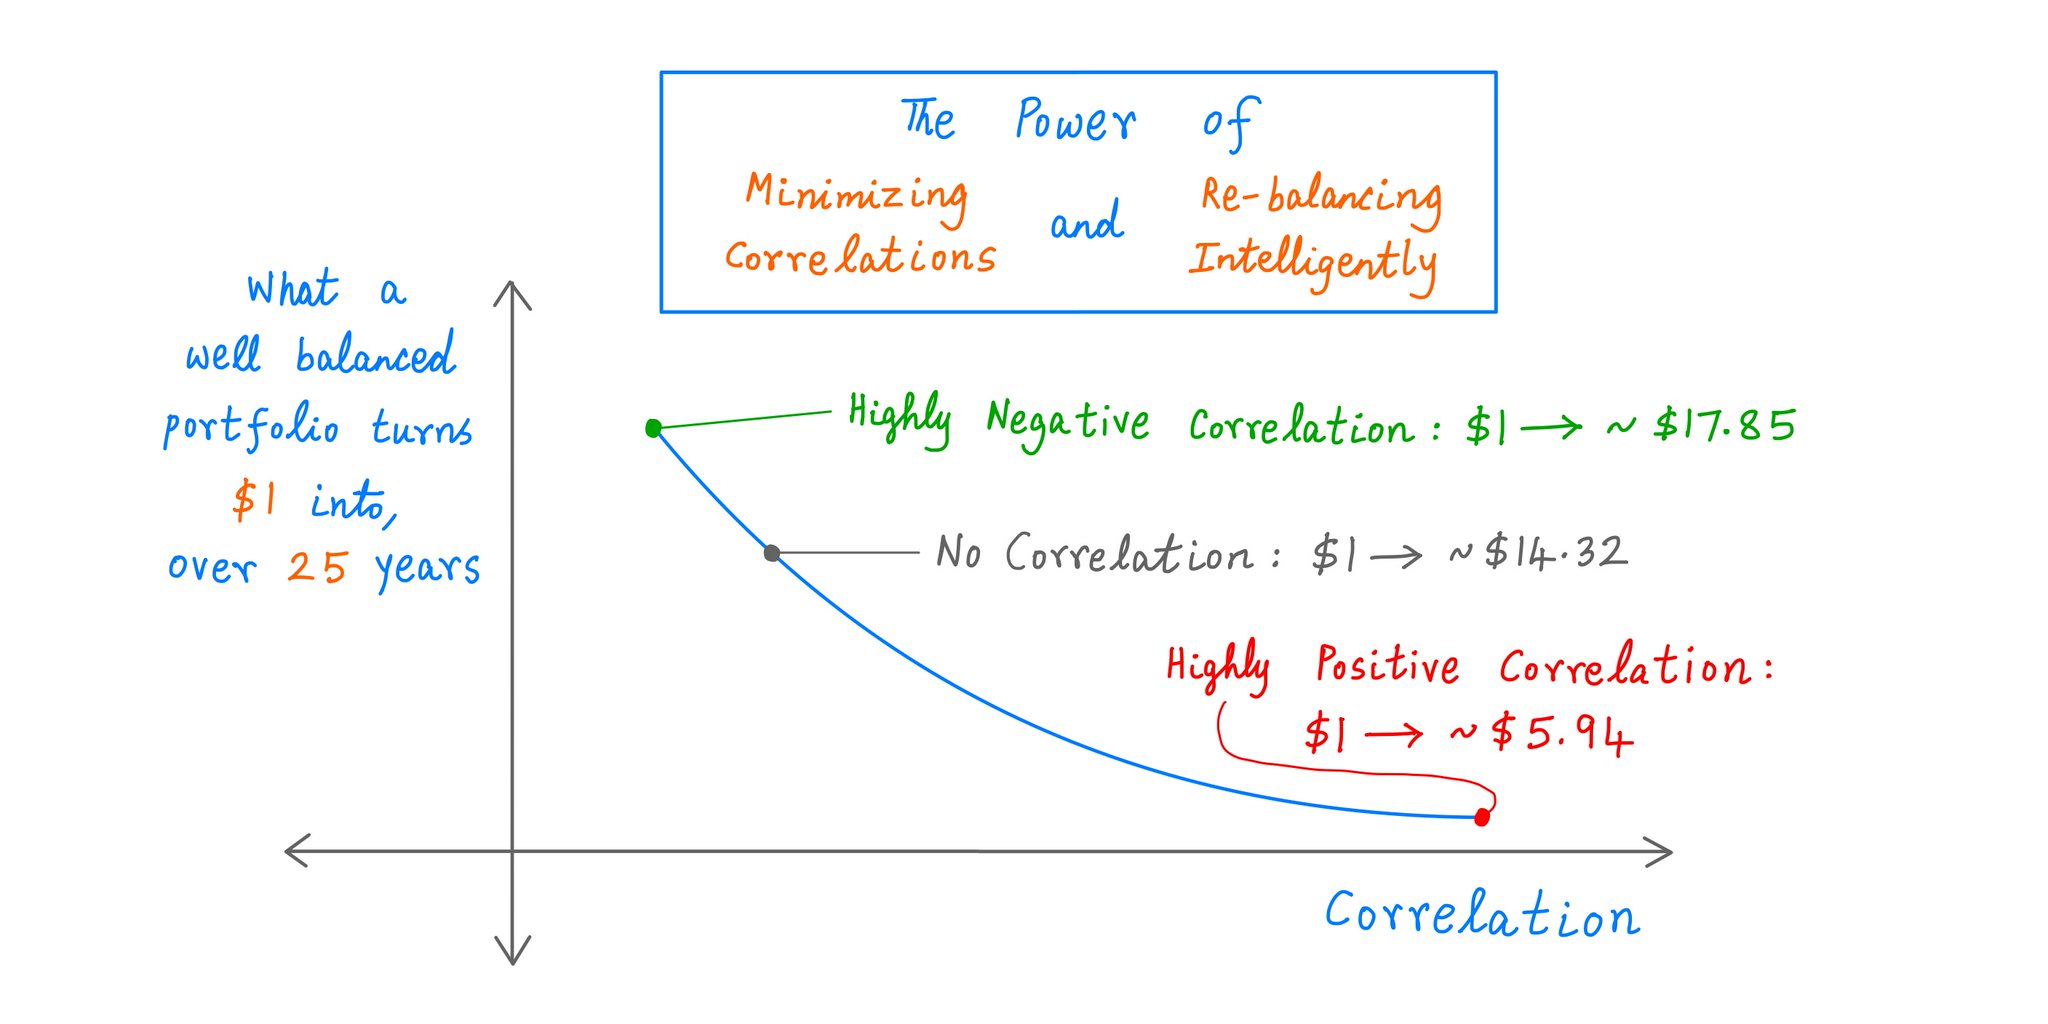
Get a cup of coffee.
In this thread, I'll walk you through 2 key portfolio diversification principles:
(i) Minimizing correlations, and
(ii) Re-balancing intelligently.
You don't need Markowitz's portfolio theory or the Kelly Criterion to understand these concepts.

2/
Imagine we have a stock: ABC Inc. Ticker: $ABC.
The good thing about ABC is: in 4 out of 5 years (ie, with probability 80%), the stock goes UP 30%.
But the *rest* of the time -- ie, with probability 20%, or in 1 out of 5 years -- the stock goes DOWN 50%.
Imagine we have a stock: ABC Inc. Ticker: $ABC.
The good thing about ABC is: in 4 out of 5 years (ie, with probability 80%), the stock goes UP 30%.
But the *rest* of the time -- ie, with probability 20%, or in 1 out of 5 years -- the stock goes DOWN 50%.
3/
We have no way to predict in advance which years will be good and which will be bad.
So, let's say we just buy and hold ABC stock for a long time -- like 25 years.
The question is: what return are we most likely to get from ABC over these 25 years?
We have no way to predict in advance which years will be good and which will be bad.
So, let's say we just buy and hold ABC stock for a long time -- like 25 years.
The question is: what return are we most likely to get from ABC over these 25 years?
4/
We know ABC stock goes UP 80% of the time and DOWN the other 20%.
So, the most likely scenario is:
During our 25 year holding period, we'll get 20 UP years and 5 DOWN years.
This gets us an annualized return of ~7.39%. Each $1 we put in becomes ~$5.94.
Calculations: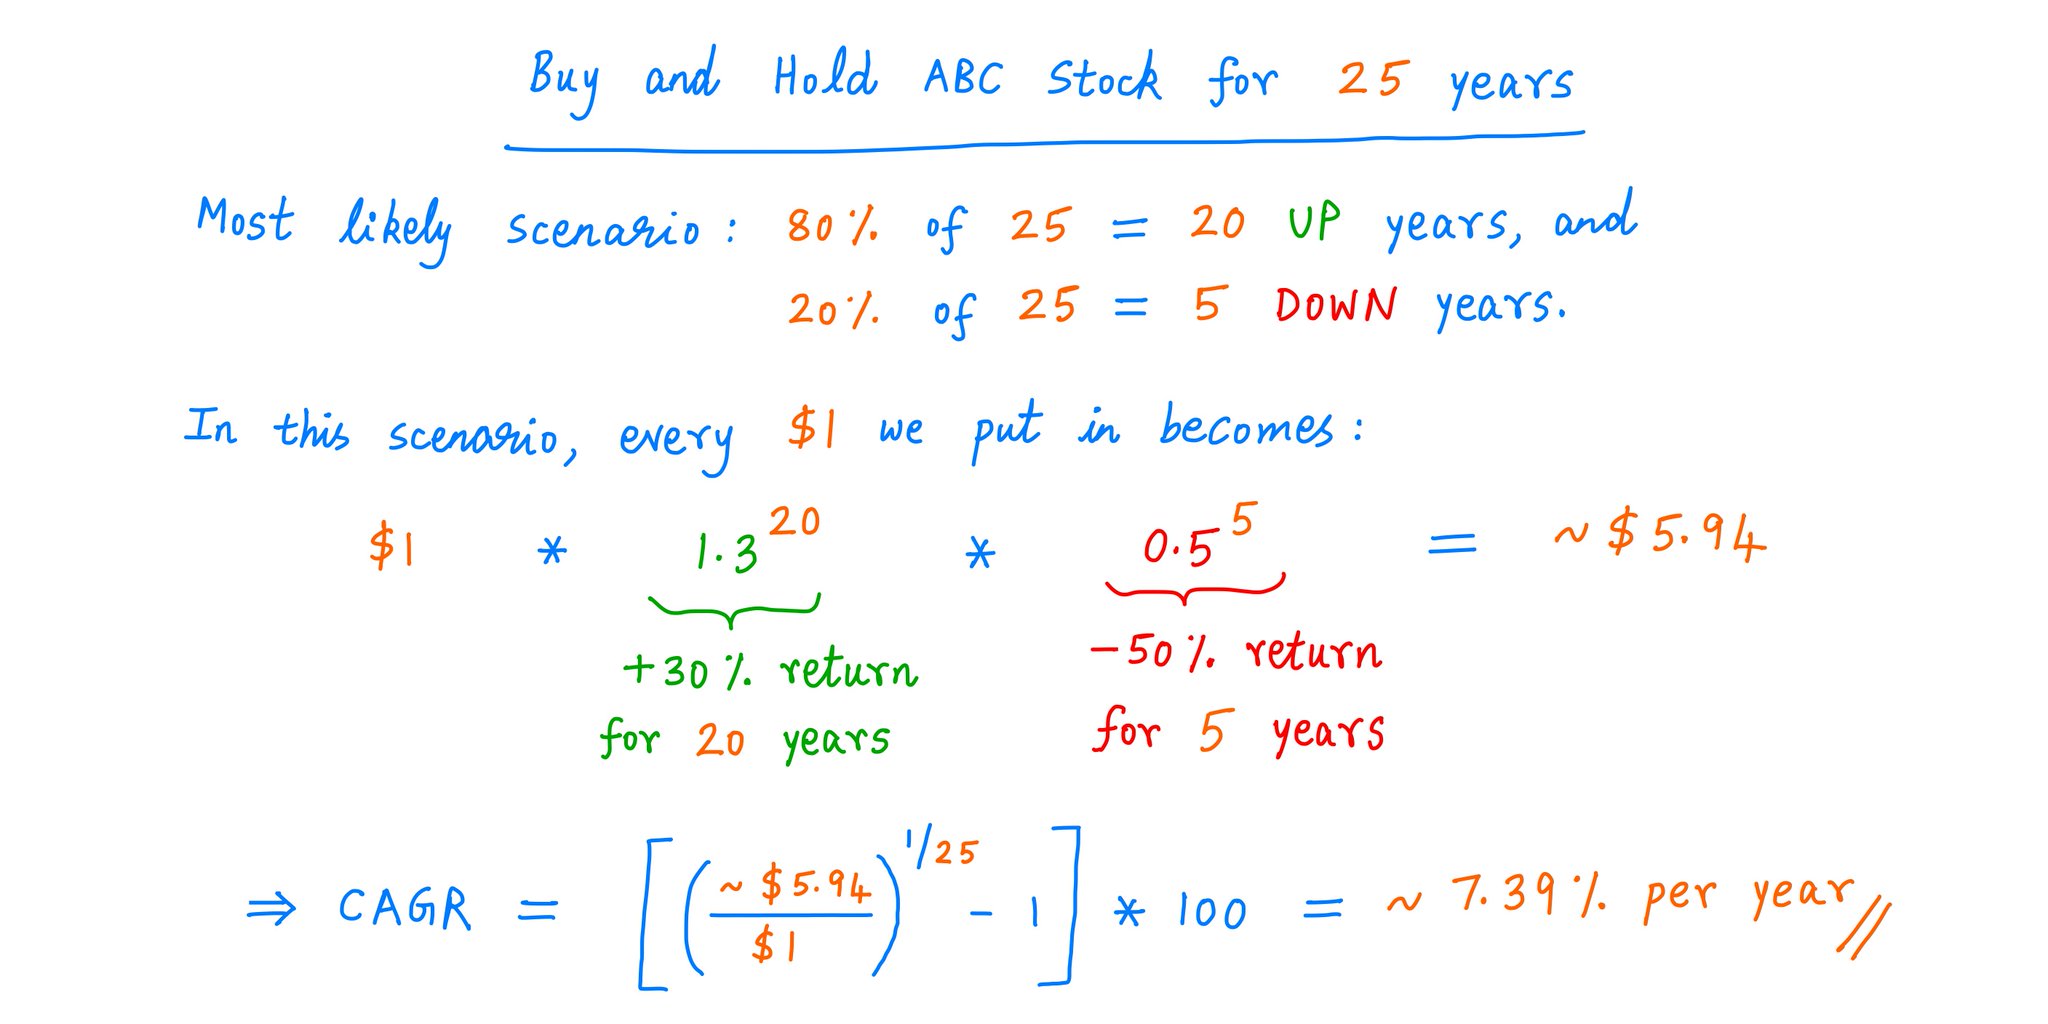
We know ABC stock goes UP 80% of the time and DOWN the other 20%.
So, the most likely scenario is:
During our 25 year holding period, we'll get 20 UP years and 5 DOWN years.
This gets us an annualized return of ~7.39%. Each $1 we put in becomes ~$5.94.
Calculations:

5/
Now let's bring in a second stock: XYZ Inc. Ticker: $XYZ.
Suppose $XYZ exhibits exactly the same statistical characteristics as $ABC.
That is, $XYZ also goes UP 30% in 4 out of 5 years and DOWN 50% in 1 out of 5 years.
But $XYZ and $ABC don't necessarily move *together*.
Now let's bring in a second stock: XYZ Inc. Ticker: $XYZ.
Suppose $XYZ exhibits exactly the same statistical characteristics as $ABC.
That is, $XYZ also goes UP 30% in 4 out of 5 years and DOWN 50% in 1 out of 5 years.
But $XYZ and $ABC don't necessarily move *together*.
6/
In some years, *both* $ABC and $XYZ go UP.
In other years, they *both* go DOWN.
And in still other years, they move in *opposite* directions. That is, *one of them* goes UP and the *other* goes DOWN.
In some years, *both* $ABC and $XYZ go UP.
In other years, they *both* go DOWN.
And in still other years, they move in *opposite* directions. That is, *one of them* goes UP and the *other* goes DOWN.
7/
The more often these stocks move *together* -- ie, *both* UP or *both* DOWN -- the more *positively correlated* we say they are.
And why do we care?
Because the MORE positively correlated our stocks are, the LESS benefit we'll get from diversification.
The more often these stocks move *together* -- ie, *both* UP or *both* DOWN -- the more *positively correlated* we say they are.
And why do we care?
Because the MORE positively correlated our stocks are, the LESS benefit we'll get from diversification.
8/
Suppose our stocks *both* go UP together X% of the time.
Thus, higher X means higher correlation.
Simple probability math now tells us:
(i) Our stocks will go DOWN together (X - 60)% of the time, and
(ii) They'll move in opposite directions (160 - 2*X)% of the time.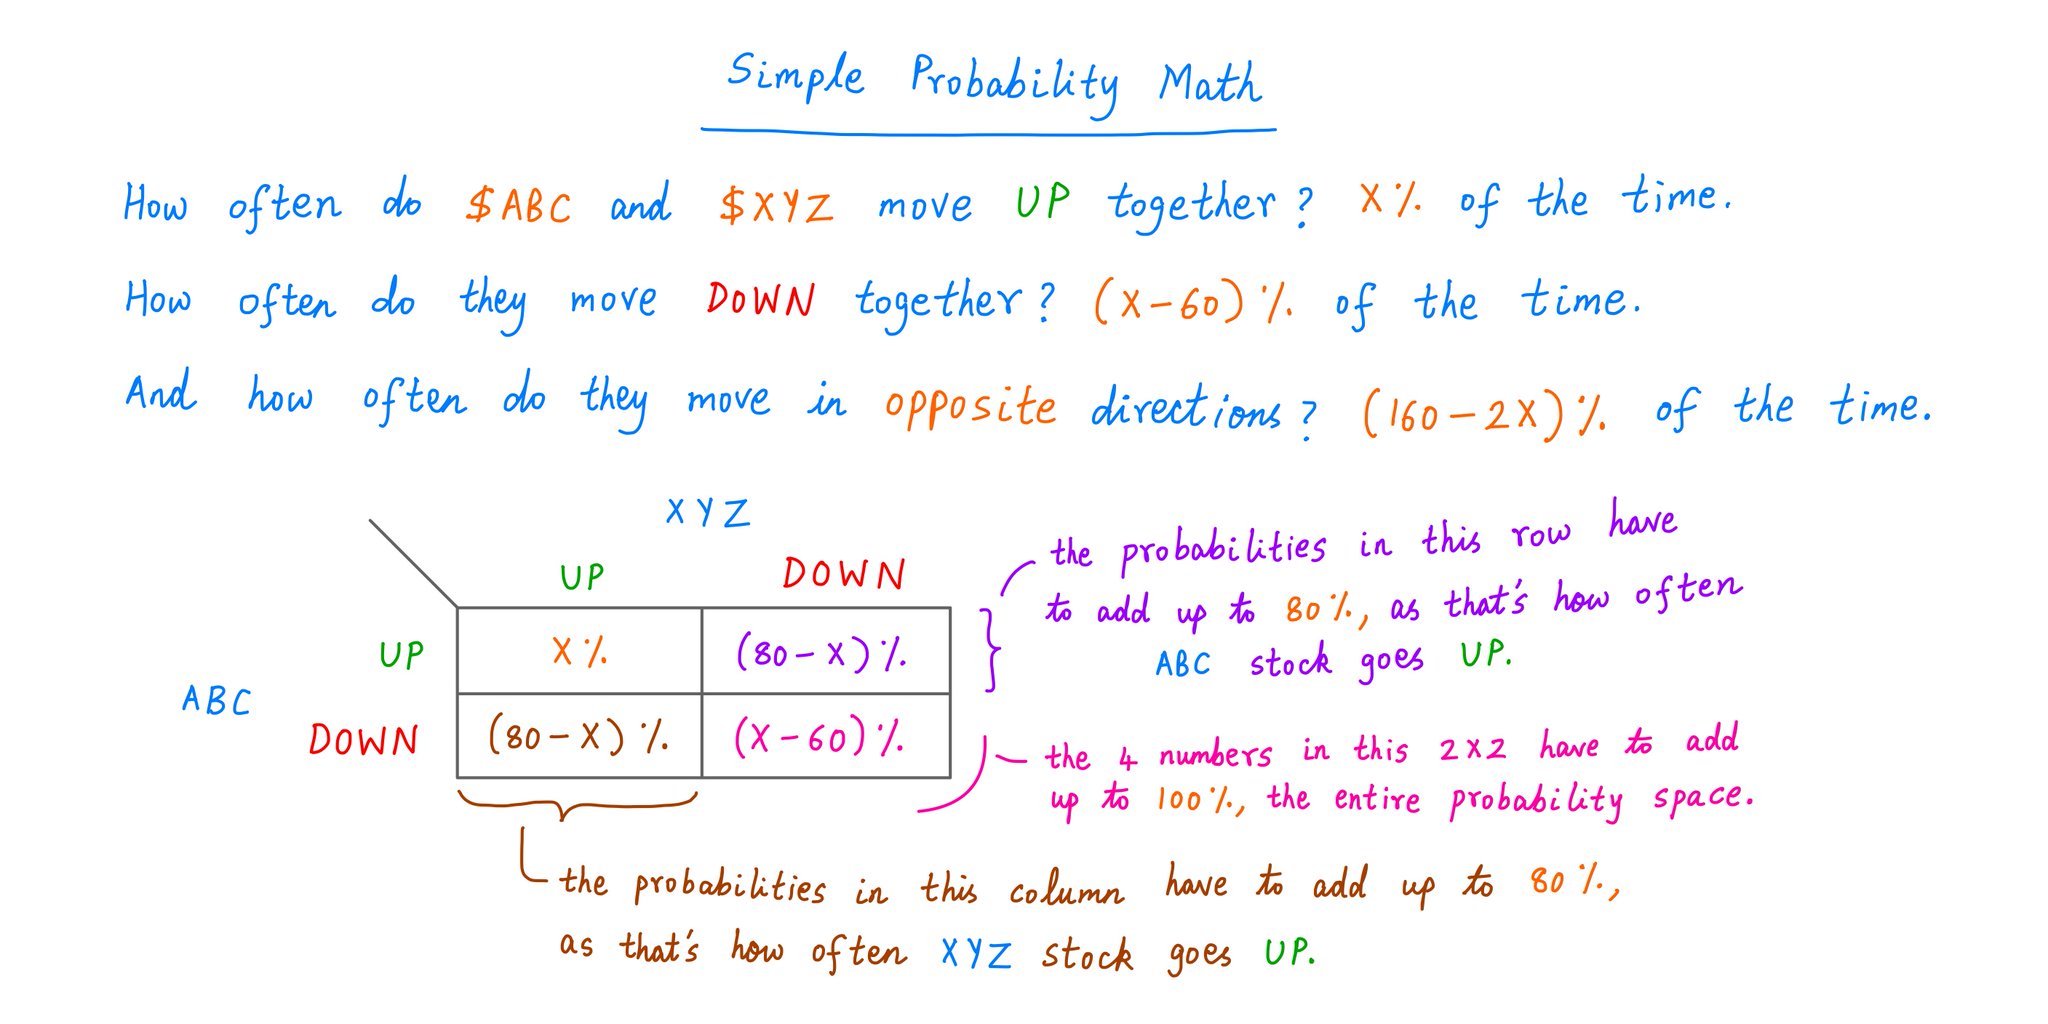
Suppose our stocks *both* go UP together X% of the time.
Thus, higher X means higher correlation.
Simple probability math now tells us:
(i) Our stocks will go DOWN together (X - 60)% of the time, and
(ii) They'll move in opposite directions (160 - 2*X)% of the time.

9/
Also, the probabilities in our 2x2 diagram above cannot be negative.
That is, neither (80 - X)% nor (X - 60)% can be negative.
That means X has to lie between 60% and 80%.
Also, the probabilities in our 2x2 diagram above cannot be negative.
That is, neither (80 - X)% nor (X - 60)% can be negative.
That means X has to lie between 60% and 80%.
10/
At X = 60%, our stocks are as *negatively* correlated as they can be.
And as we raise X from 60% to 80%, their correlation turns strongly *positive*.
The crossover from negative to positive occurs at X = 64%. At that point, there's *zero* correlation between our stocks.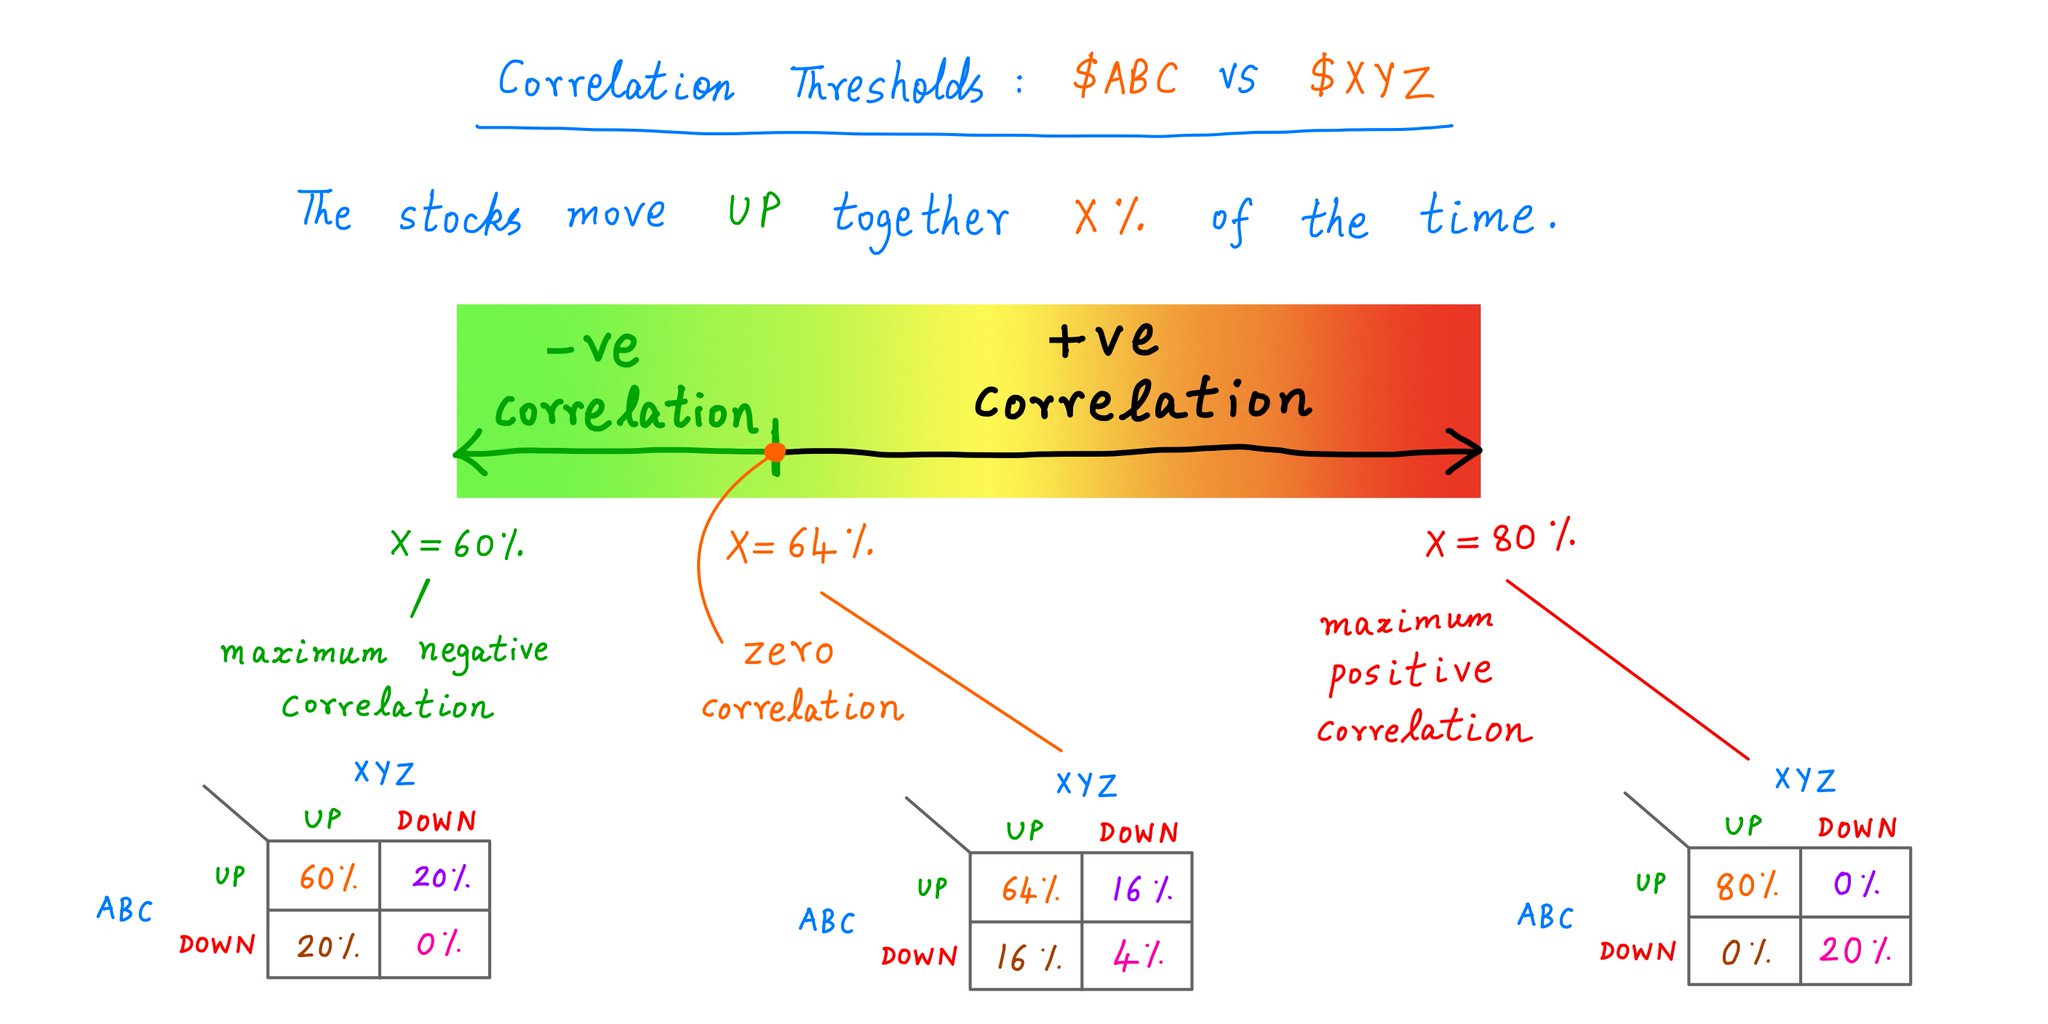
At X = 60%, our stocks are as *negatively* correlated as they can be.
And as we raise X from 60% to 80%, their correlation turns strongly *positive*.
The crossover from negative to positive occurs at X = 64%. At that point, there's *zero* correlation between our stocks.

11/
The central idea behind diversification is: everything shouldn't blow up *at the same time*.
In other words, we *don't* want our stocks all moving *together*.
That's why *negative* correlations are "good" and *positive* correlations are "bad".
The central idea behind diversification is: everything shouldn't blow up *at the same time*.
In other words, we *don't* want our stocks all moving *together*.
That's why *negative* correlations are "good" and *positive* correlations are "bad".
12/
But to REALLY take advantage of negative correlations, we need another key idea: intelligent re-balancing.
Let's run some numbers to see why.
Suppose X = 60%. That is, $ABC and $XYZ are as negatively correlated as possible.
But to REALLY take advantage of negative correlations, we need another key idea: intelligent re-balancing.
Let's run some numbers to see why.
Suppose X = 60%. That is, $ABC and $XYZ are as negatively correlated as possible.
13/
Now, suppose we build a 50/50 diversified portfolio of $ABC and $XYZ.
We'll hold this portfolio for 25 years.
But we'll never re-balance. We'll just let each individual stock ride.
What will our most likely 25-year return be?
Now, suppose we build a 50/50 diversified portfolio of $ABC and $XYZ.
We'll hold this portfolio for 25 years.
But we'll never re-balance. We'll just let each individual stock ride.
What will our most likely 25-year return be?
14/
Well, if we never re-balance, each stock is just going to do its thing individually.
Each is likely to give us 20 UP years and 5 DOWN years -- though not in the same order.
This will let us turn $1 into ~$5.94 -- the same ~7.39% annualized return we had before.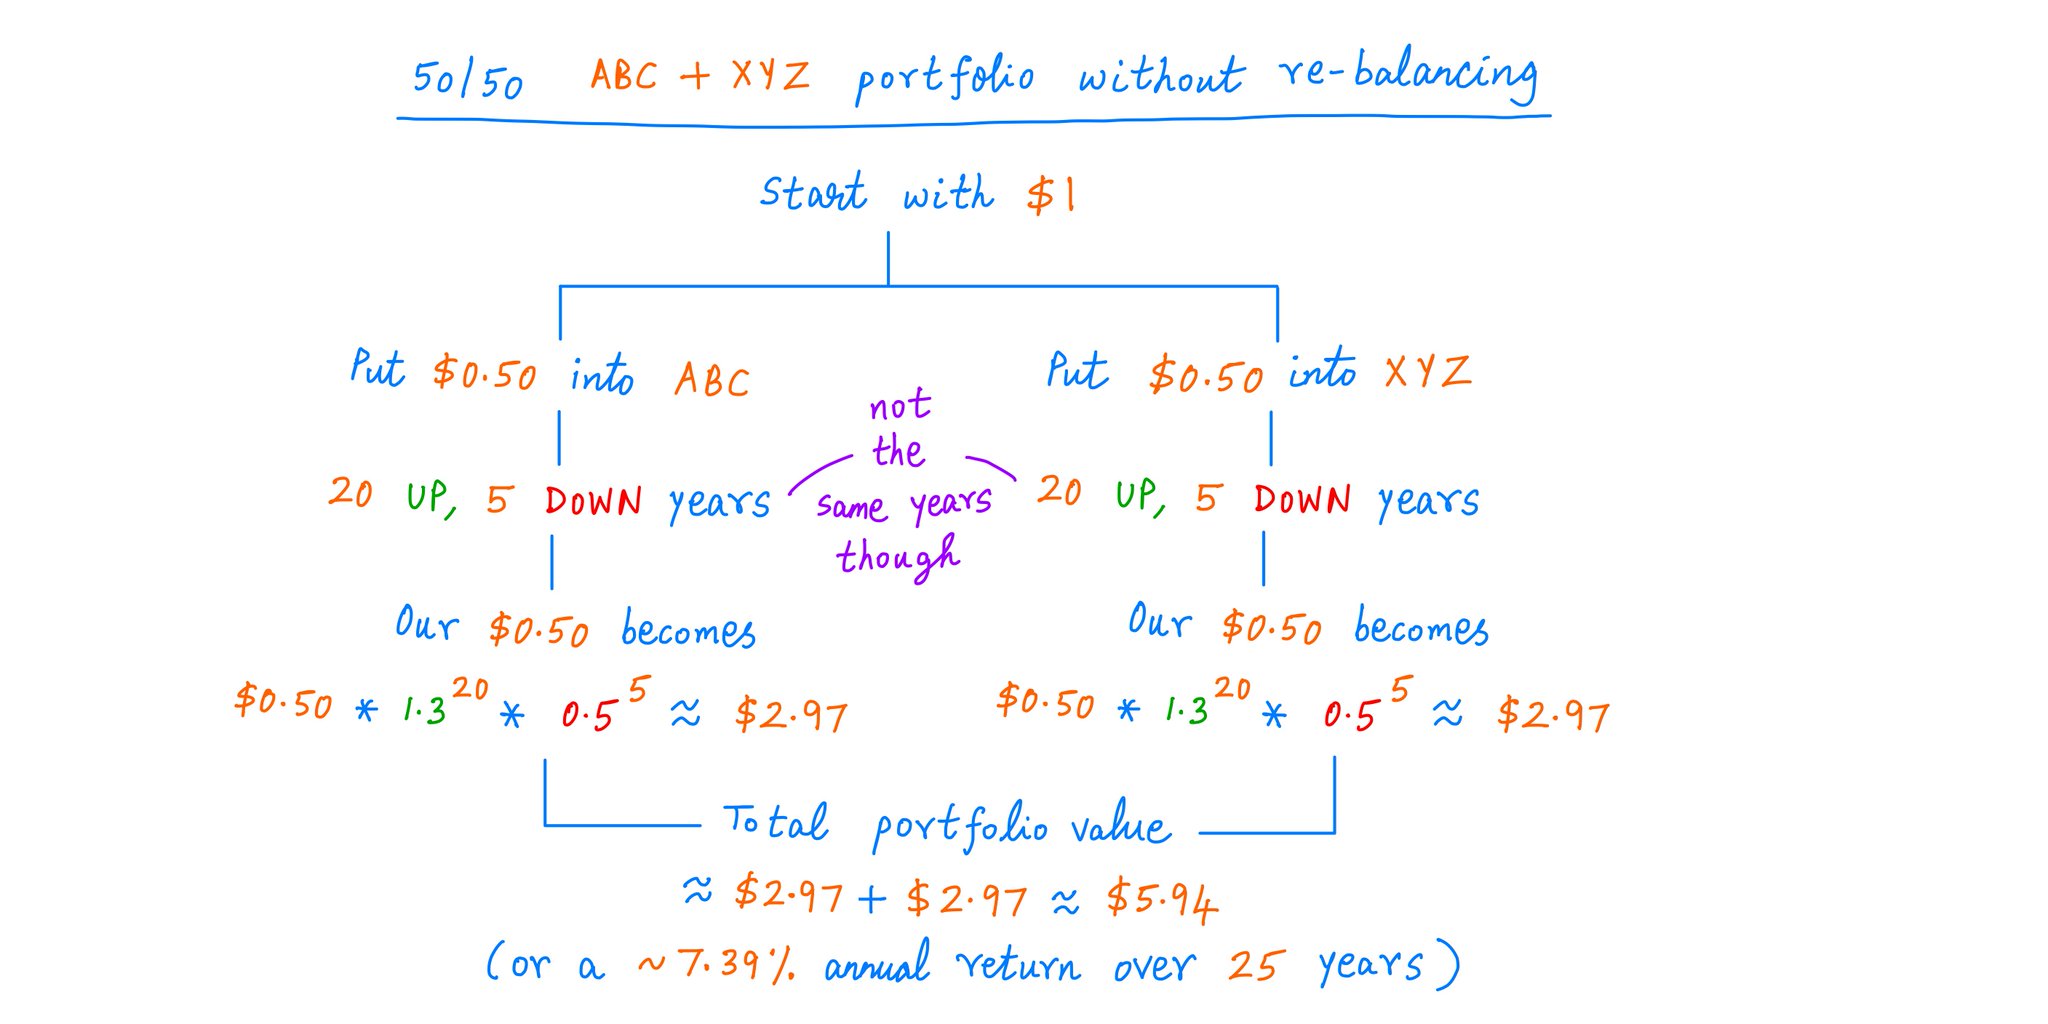
Well, if we never re-balance, each stock is just going to do its thing individually.
Each is likely to give us 20 UP years and 5 DOWN years -- though not in the same order.
This will let us turn $1 into ~$5.94 -- the same ~7.39% annualized return we had before.

15/
Thus, the *negative* correlation between $ABC and $XYZ does NOT help us if we don't re-balance.
Whether we own:
- Just $ABC,
- Or just $XYZ,
- Or a 50/50 "$ABC plus $XYZ" combo,
we're likely to end up at the exact same place -- earning ~7.39% per year.
Thus, the *negative* correlation between $ABC and $XYZ does NOT help us if we don't re-balance.
Whether we own:
- Just $ABC,
- Or just $XYZ,
- Or a 50/50 "$ABC plus $XYZ" combo,
we're likely to end up at the exact same place -- earning ~7.39% per year.
16/
What happens if we *do* re-balance our portfolio periodically -- say, every year?
For example, if $ABC goes UP and $XYZ goes DOWN during a year, we sell a bit of $ABC at the end of the year and use the money to buy a bit of $XYZ -- so our portfolio is again back at 50/50.
What happens if we *do* re-balance our portfolio periodically -- say, every year?
For example, if $ABC goes UP and $XYZ goes DOWN during a year, we sell a bit of $ABC at the end of the year and use the money to buy a bit of $XYZ -- so our portfolio is again back at 50/50.
17/
With this re-balancing strategy in place, here are all the outcomes that can possibly happen during any given year -- along with their respective probabilities: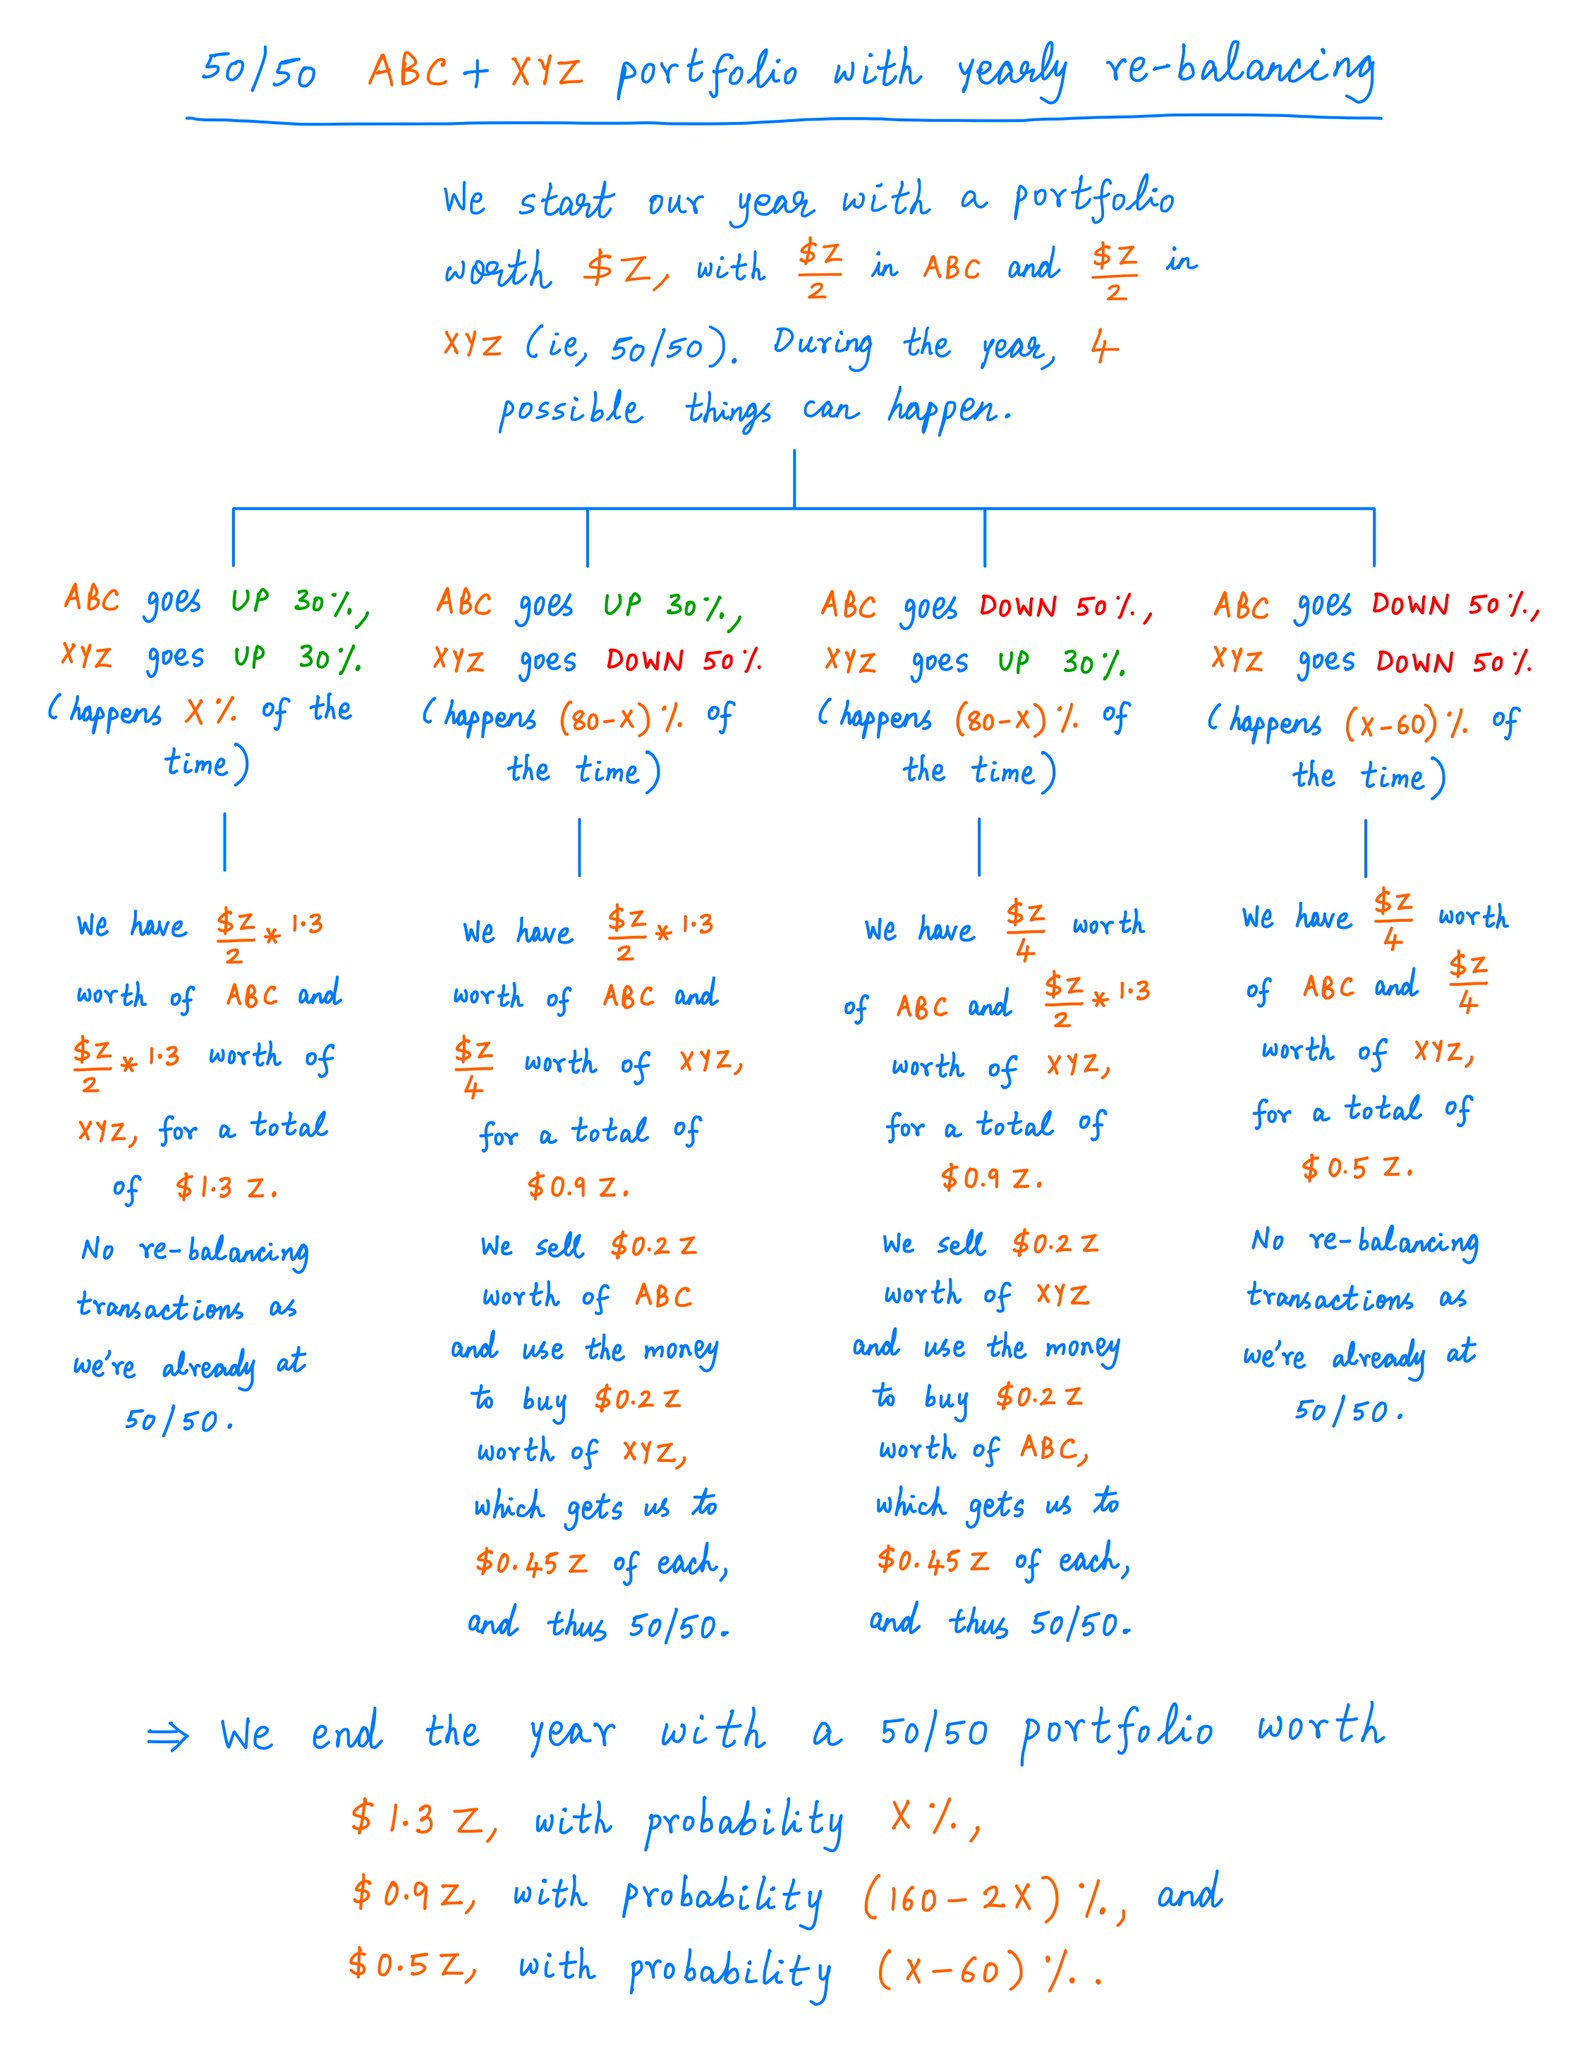
With this re-balancing strategy in place, here are all the outcomes that can possibly happen during any given year -- along with their respective probabilities:

18/
For example, with X = 60% -- our strongest possible negative correlation -- our portfolio:
- Goes UP 30% in 3 out of 5 years, and
- Goes down 10% in 2 out of 5 years.
Over 25 years, our most likely outcome turns $1 into ~$17.85.
That's ~12.22% annualized.
Calculations: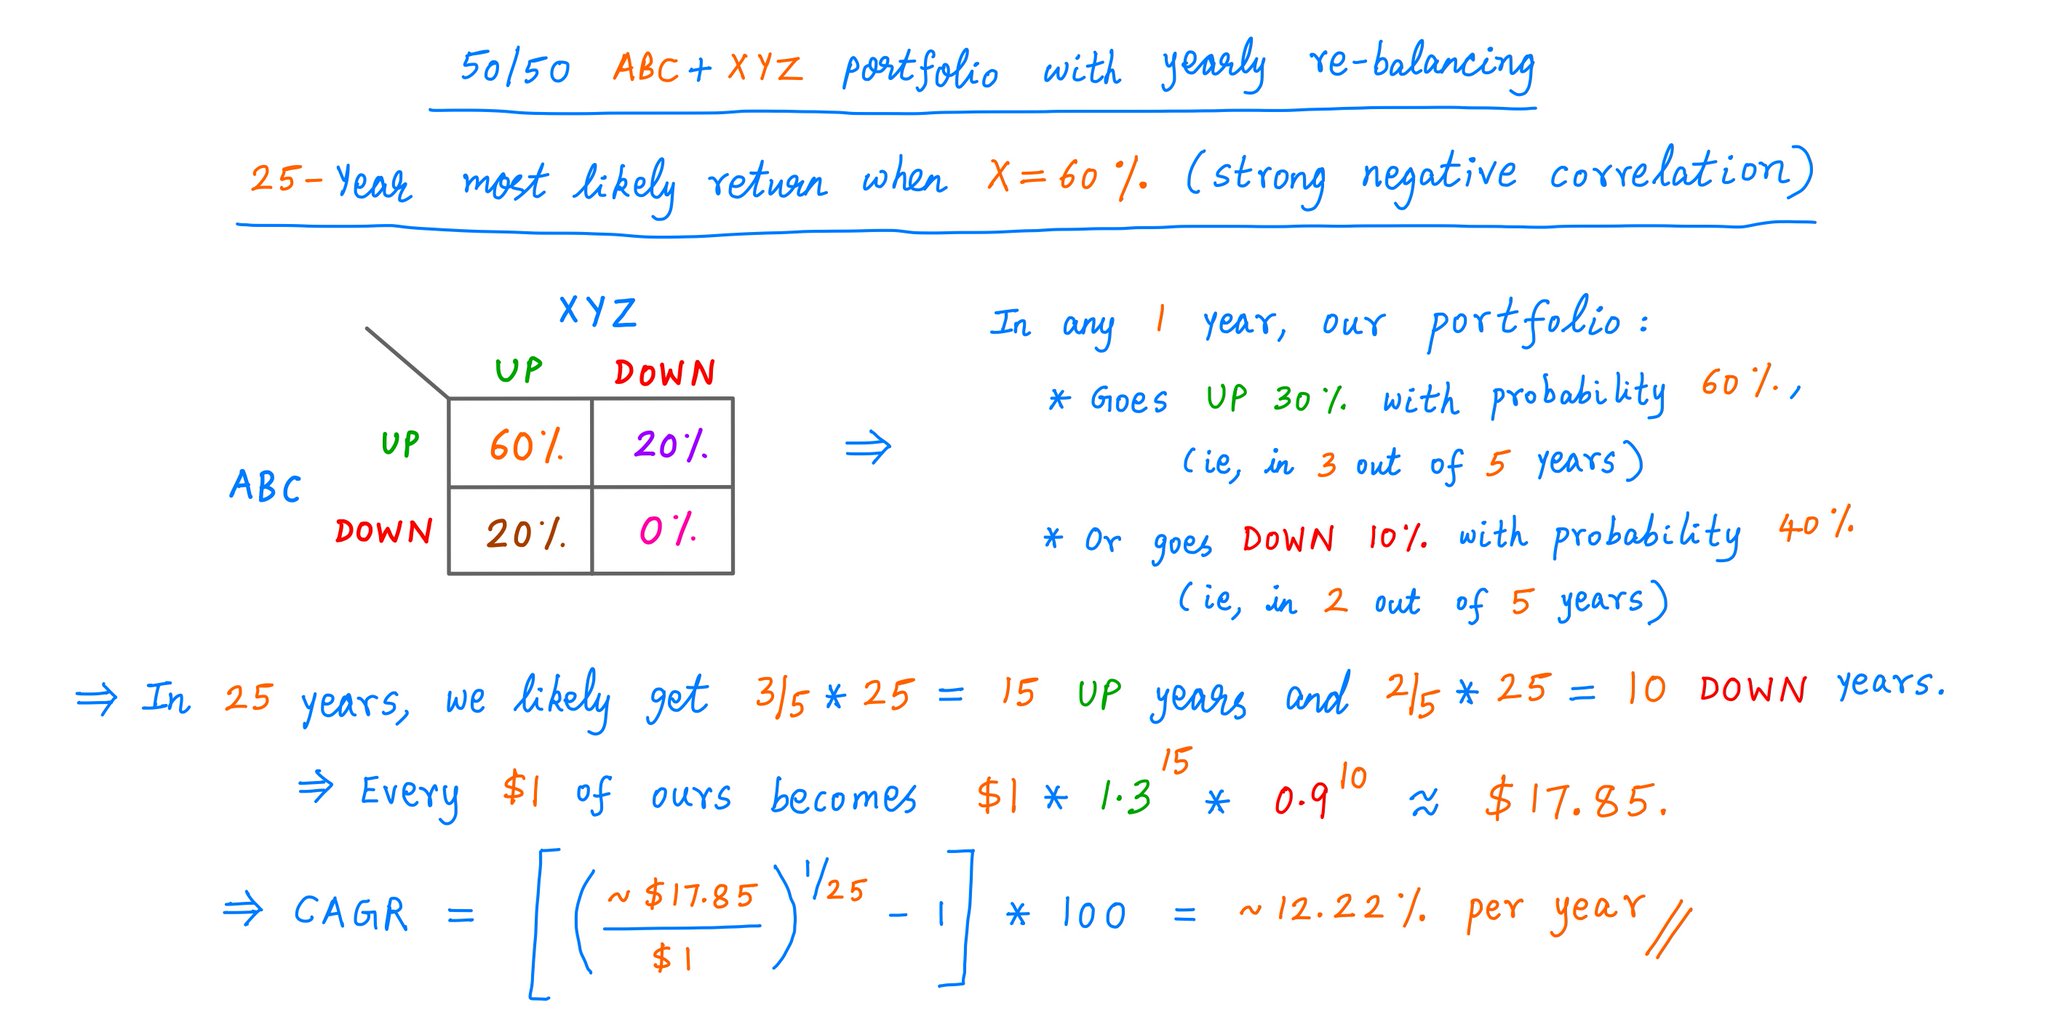
For example, with X = 60% -- our strongest possible negative correlation -- our portfolio:
- Goes UP 30% in 3 out of 5 years, and
- Goes down 10% in 2 out of 5 years.
Over 25 years, our most likely outcome turns $1 into ~$17.85.
That's ~12.22% annualized.
Calculations:

19/
So, when X = 60% (ie, strongly negative correlation), we have:
*Without* re-balancing: $1 --> ~$5.94, and
*With* re-balancing: $1 --> ~$17.85 (>3x as much!),
over the same 25 years.
Thus, negative correlations + re-balancing can be a powerful combination.
So, when X = 60% (ie, strongly negative correlation), we have:
*Without* re-balancing: $1 --> ~$5.94, and
*With* re-balancing: $1 --> ~$17.85 (>3x as much!),
over the same 25 years.
Thus, negative correlations + re-balancing can be a powerful combination.
20/
If we do this well, our *portfolio* can end up getting us a HIGHER return than any single stock in it!
We just saw an example with 2 stocks. Each got us only ~7.39%. But a 50/50 re-balanced portfolio of them got us ~12.22%.
When I first saw this, I couldn't believe it!
If we do this well, our *portfolio* can end up getting us a HIGHER return than any single stock in it!
We just saw an example with 2 stocks. Each got us only ~7.39%. But a 50/50 re-balanced portfolio of them got us ~12.22%.
When I first saw this, I couldn't believe it!
21/
This is the ESSENCE of diversification.
- We minimize correlations, so our portfolio nearly always has *both* risen and fallen stocks, and
- We "cash in" on this gap via re-balancing -- ie, we periodically sell over-valued stocks and put the money into under-valued ones.
This is the ESSENCE of diversification.
- We minimize correlations, so our portfolio nearly always has *both* risen and fallen stocks, and
- We "cash in" on this gap via re-balancing -- ie, we periodically sell over-valued stocks and put the money into under-valued ones.
22/
Also, negative correlations aren't strictly necessary.
We could use stocks with zero -- or even positive -- correlation.
But the MORE heavily correlated our stocks, the LESS "bang for the buck" we get from re-balancing.
Like so: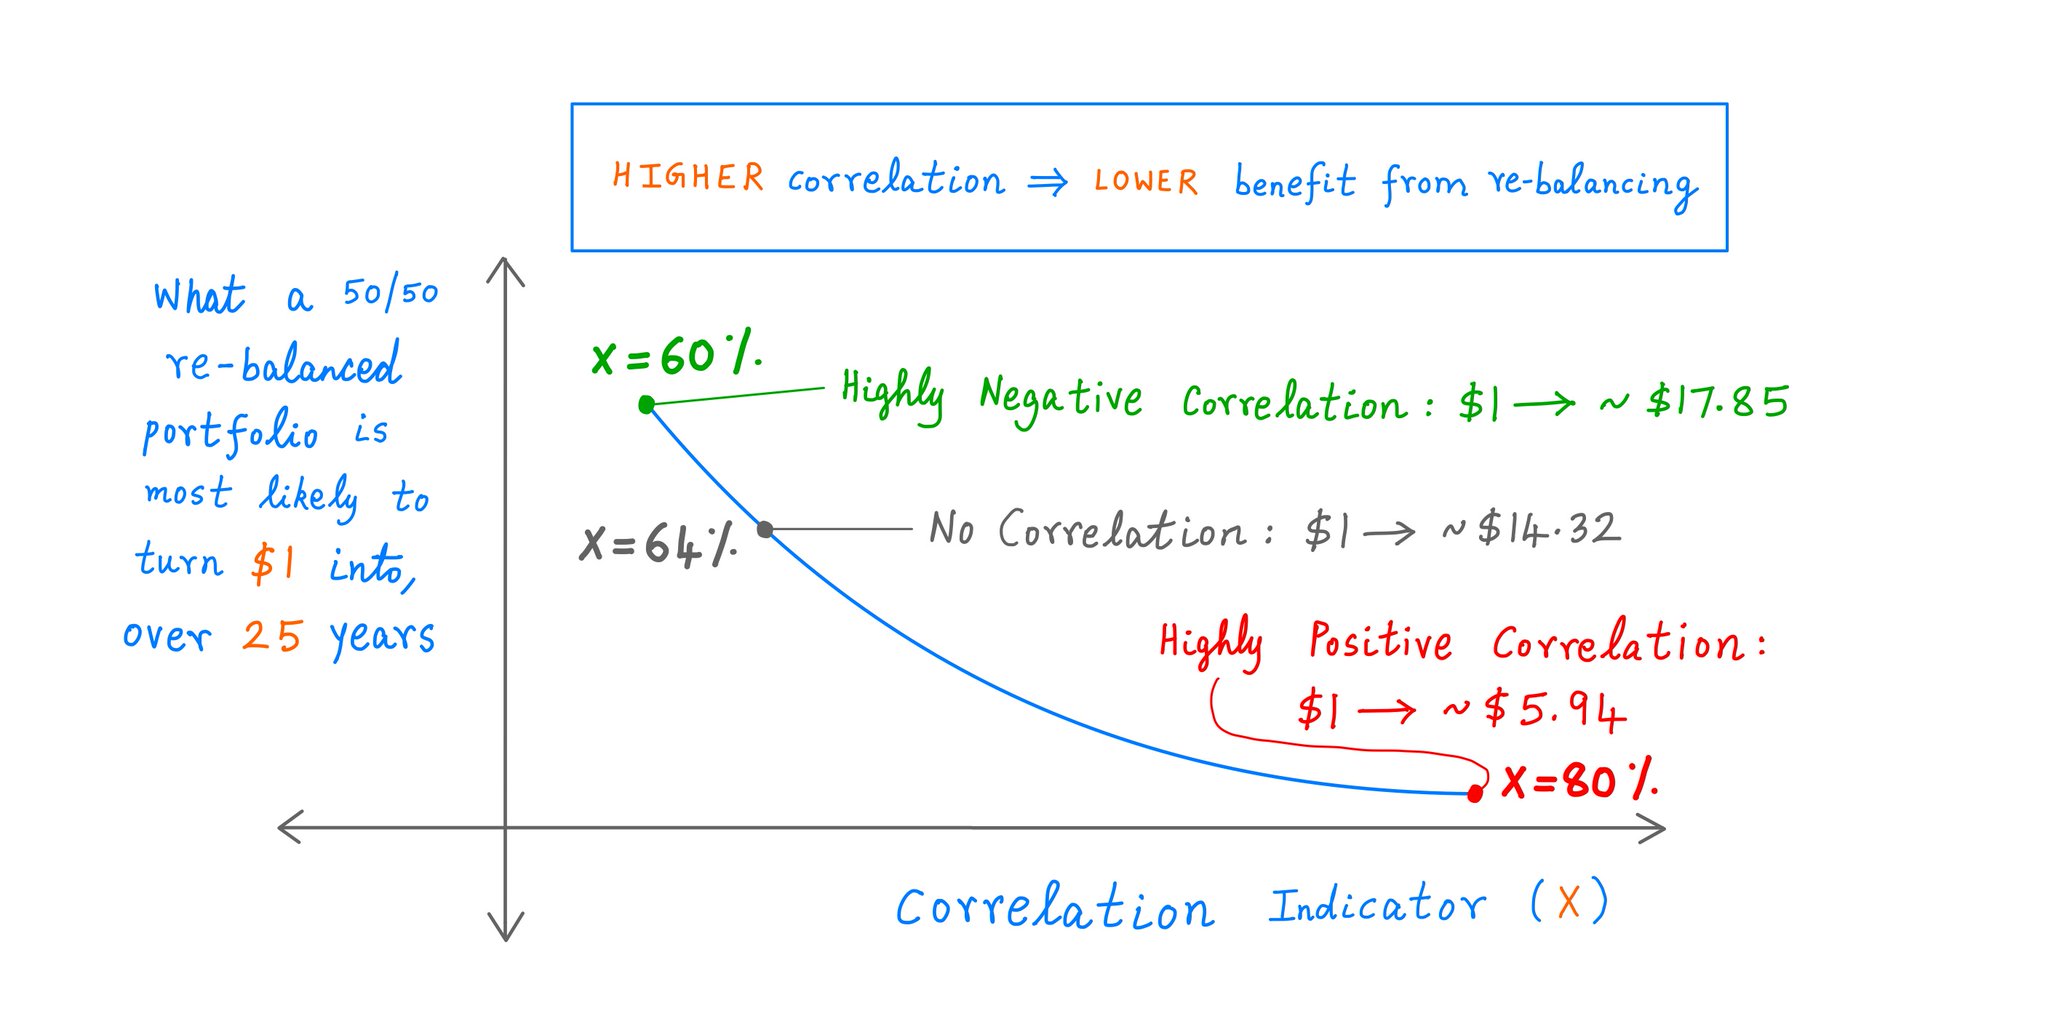
Also, negative correlations aren't strictly necessary.
We could use stocks with zero -- or even positive -- correlation.
But the MORE heavily correlated our stocks, the LESS "bang for the buck" we get from re-balancing.
Like so:

23/
As investors, we spend a lot of time analyzing individual stocks.
But we tend to focus less on *portfolio* construction: do our stocks fit well together? Are we re-balancing sensibly? Etc.
I hope this thread shed some light on these topics.
Happy Diwali folks!
/End
As investors, we spend a lot of time analyzing individual stocks.
But we tend to focus less on *portfolio* construction: do our stocks fit well together? Are we re-balancing sensibly? Etc.
I hope this thread shed some light on these topics.
Happy Diwali folks!
/End