Thread by Jurrien Timmer
- Tweet
- Oct 28, 2022
- #CentralBank #Economics
Thread
What does the TIPS market know that the stock market and the Fed are not seeing? Why is the Fed committing to an extreme policy when inflation will presumably no longer be a clear and present danger? Or are TIPS just plain wrong? 🧵 3 of 3 on the topic 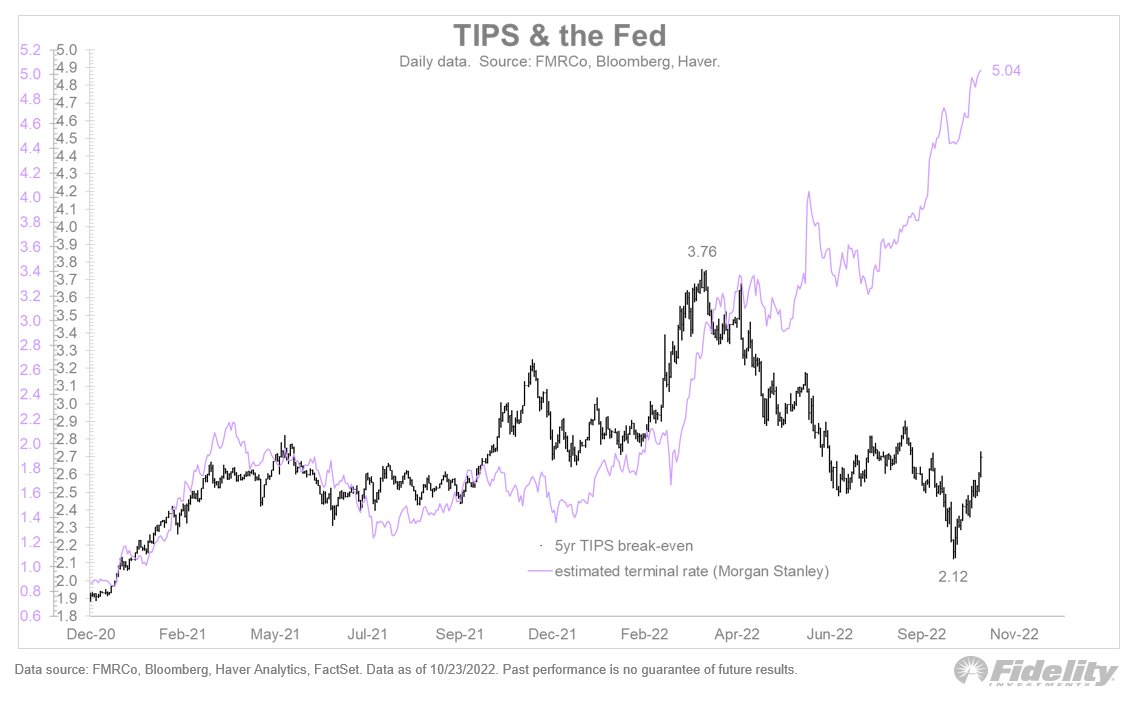

The chart above shows the expected terminal rate for the Fed (purple) against the 5-year TIPS B/E. They were moving in the same direction until April but have been diverging ever since. To me, this shows a relationship that has evolved from linear to non-linear. /2
Another way of showing this is through the evolving correlation below. The orange dots show the relationship between the core PCE and 5-year TIPS from 2002 through 2020, and the purple dots show the history since then. /3 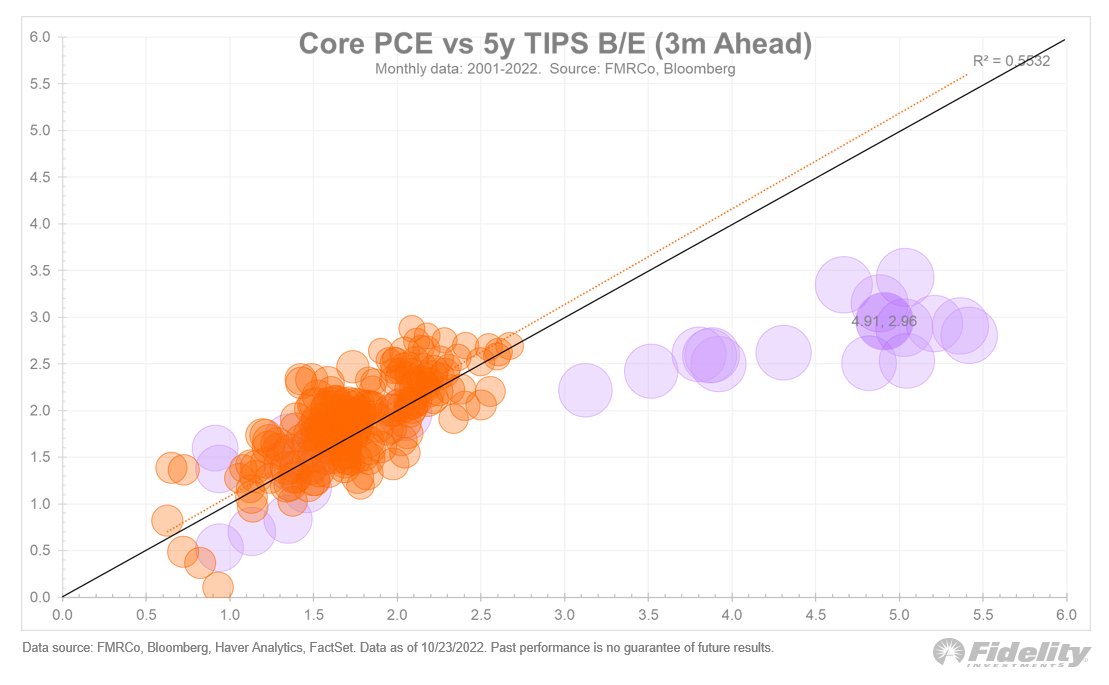

The size of each dot above represents the share of the TIPS market that is owned by the Fed. /4
The current inflation spike is the most anomalous of the past 20 years, except for the financial crisis in 2008, which produced negative TIPS break-evens as a result of a liquidity squeeze. /5
Does this disconnect between the TIPS market and headline inflation reflect the Fed’s outsized ownership? I don’t think so. If it did, the TIPS market would be sending a much different signal than the inflation swap market, which isn’t distorted by the Fed. /6
Below I show a scatter plot of the 5-year TIPS break-even and the 5-year inflation swap. The slope between the two series is 1 (the same as the black line), regardless of the Fed owning a large swath of the TIPS market. /7 
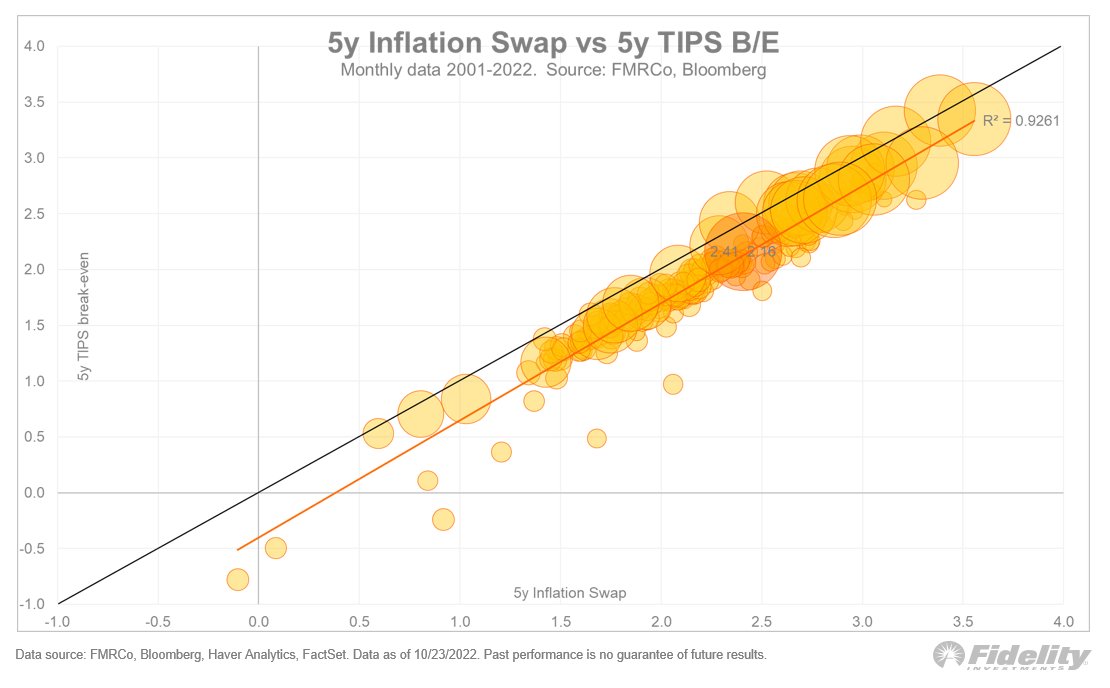
The orange line is below the black line, reflecting the counterparty risk inherent in a swap. Also, the latest monthly value (2.16% for TIPS, 2.41% for swap) is right on the trend line. So, , I don’t think this is the answer. /8
If the TIPS signal is not a distortion caused by market structure or dysfunction, then what is it? My guess is that the TIPS market reflects the non-linearity (or cause-and-effect) of a Fed that is committed to bringing inflation back to its 2% target. /9
Whether this happens smoothly through a soft landing, or harshly through an overly restrictive policy that causes a recession, is vitally important for nominal bonds and equities, but perhaps neither-here-nor-there for the TIPS market. /10
One way or the other, the Fed will get inflation down, so maybe the TIPS market is just telling us that. /11
The chart below shows the 5-year TIPS break-even, CPI and core PCE, as well as their 20-year regression trendlines. Those trendlines are as flat as a pancake. /12 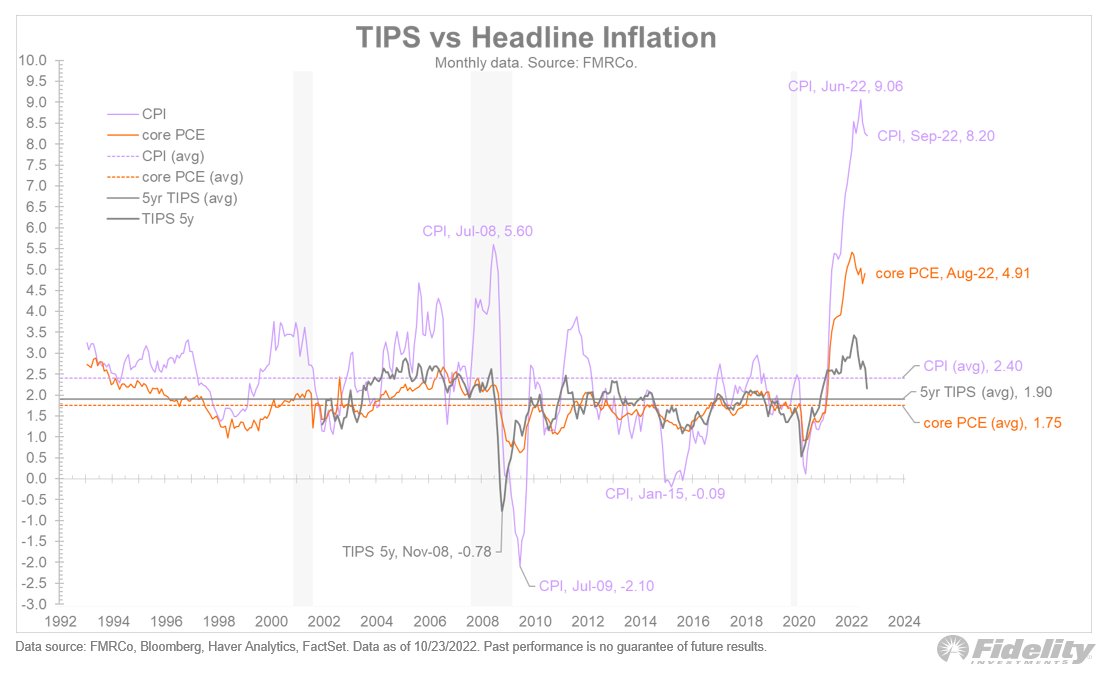

All three series have consistently mean-reverted around their regression lines. The TIPS market is well on its way to getting back to its trendline of 1.9%, but the CPI and core PCE remain well above their averages (at 8.21% and 4.91%, respectively). /13
TIPS appear to be telling us to believe in mean-reversion in the inflation rate. /14
Perhaps we are at the start of a secular regime change for inflation, in which case the TIPS market is being too linear in its expectations for mean reversion. /15
But if the Fed is going to get inflation back to target, even if it produces a recession or keeps the Fed above neutral for the foreseeable future, then the signal from the TIPS market looks to be one to believe. The question is how smooth the path to 2% will be. /END