Thread
1. This week in Ag Data News, as we look ahead to the holiday season, what's going on with food price inflation? agdatanews.substack.com/p/agricultural-prices-arent-driving?sd=pf
2. Prices in the grocery store have increased in the past two years, and it seems reasonable to look at the prices of agricultural commodities such as corn and wheat for signs of where food inflation is going.
3. Most of the price of food is processing, packaging, transportation and marketing. Agricultural commodity prices jump all over the place. Annual wheat price inflation has ranged from -50% to 150% in the past 30 years with only minor implications for consumer food prices. 

4. I am not the first to make this point. @CortneyCowley and @falscott of the Kansas City Federal Reserve Bank made it very well in a recent blog post and associated video.
5. Yet, it is true that food price inflation is high. The consumer price index (CPI) for food at home is up 13.0% in the past year, whereas the CPI across all items is up 8.2%. 

6. So, what is going on with food prices? Are they going to come down?
7. I am going to switch to showing *prices* rather than *inflation*. Economists often focus on inflation, which is the rate at which wages and prices throughout the economy are increasing. Normal people care about prices: do the things I want to buy cost more than they used to?
8. Imagine climbing a hill. Think of the price as your current elevation. Inflation is how steep the hill is where you are currently standing. In the past two years, the CPI for all items has climbed to a great height (high prices) and reached a plateau (low current inflation). 

9. Since Jan 2020, grocery store prices are up 22%. Over the same period, the all items index is up 15%. Food prices jumped up at the beginning of the pandemic due to supply chain issues. By mid 2021, they were almost back to the level of other prices before accelerating again. 

10. To understand the present and potential future, I look at two indices. First, the consumer price index for things that aren't food or energy, also known as the core CPI. This index strips out the things that bounce around a lot, so it is better indicator of future inflation.
11. Second, I look at the producer price index to see how prices are changing at different points in the supply chain. The CPI only shows prices at the end of the supply chain. The further up the supply chain you go, the less informative prices are about consumer prices. 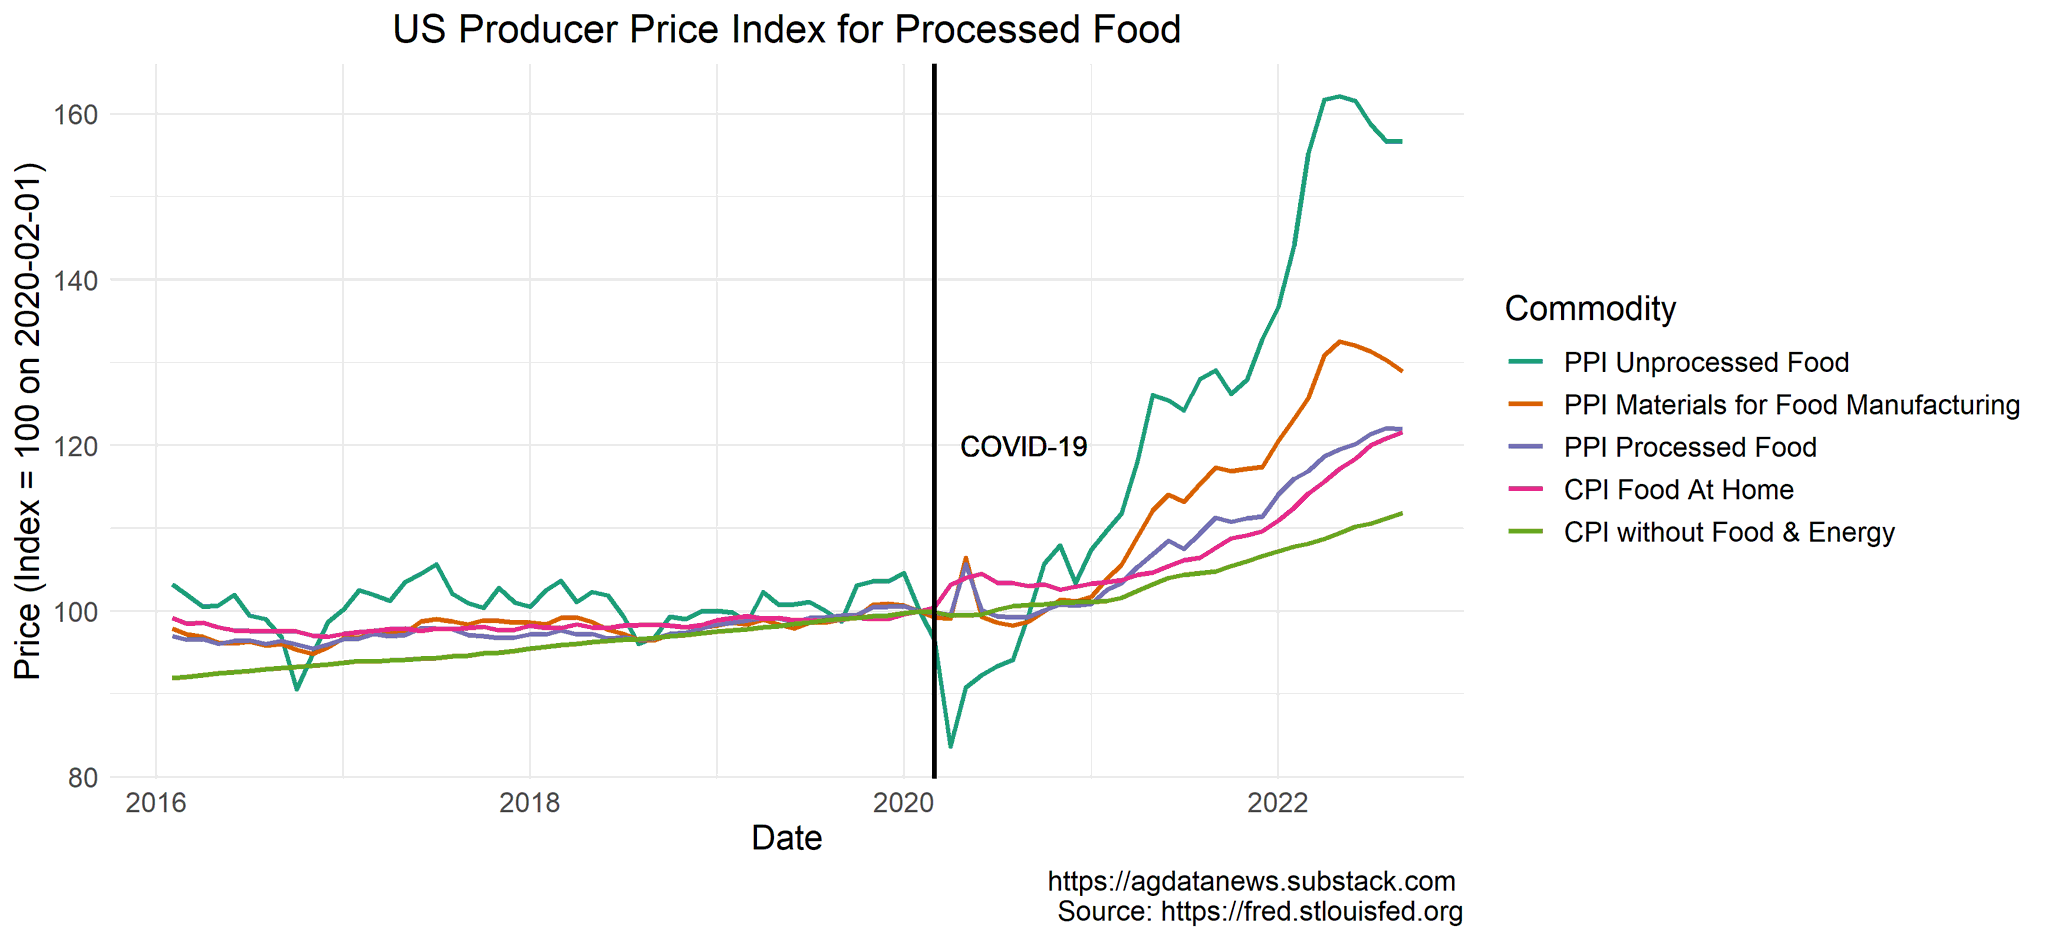

12. Prices for unprocessed food, such as fresh fruit or raw corn, are up 87% from their low point in April 2020. They are up 57% since Jan 2020, and have declined from their early-summer peak. 
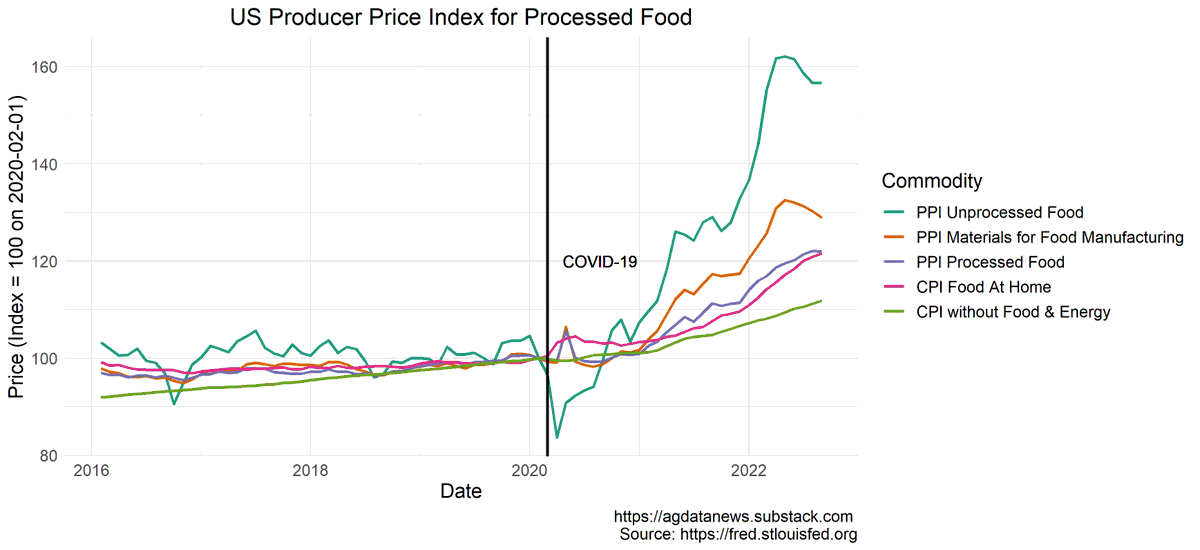
13. The price of food in the store is up 22% over the same period, but it has not declined since early summer. In these past few months, its changes better match the CPI without F&E (i.e., the core CPI). 

14. The same phenomenon is more apparent for individual products, such as bread. Wheat prices went up and down but remain high. Flour prices went up and down by less, but remain high. Bread price increases have been closer to the core CPI, although they are more volatile. 

15. Here are tomatoes. The farm price is very volatile and the price of canned ketchup and other tomato sauces mostly follows core CPI (except for a curious bump up in April 2022). 

16. To put some numbers on this, imagine three models to predict inflation in grocery store prices.
(i) % Change in CPI Food At Home = % Change in PPI Unprocessed Foods
(ii) % Change in CPI Food At Home = % Change in CPI without Food & Energy
(i) % Change in CPI Food At Home = % Change in PPI Unprocessed Foods
(ii) % Change in CPI Food At Home = % Change in CPI without Food & Energy
17. The third prediction is from a linear regression model. The model puts by far the most weight on the core CPI.
(iii) % Change in CPI Food At Home = 0.10*(% Change in PPI Unprocessed Foods) + 1.18*(% Change in CPI without Food & Energy) + 0.05*(% Change in CPI Energy) - 0.85
(iii) % Change in CPI Food At Home = 0.10*(% Change in PPI Unprocessed Foods) + 1.18*(% Change in CPI without Food & Energy) + 0.05*(% Change in CPI Energy) - 0.85
18. In the years from 1991-2022, predicting annual food inflation using the price of unprocessed foods yields an average error of 8.7%. The average error is 1.7% if we use the core CPI and 1.3% if we use the regression model (based on Sep-Sep annual inflation; 1991-2022). 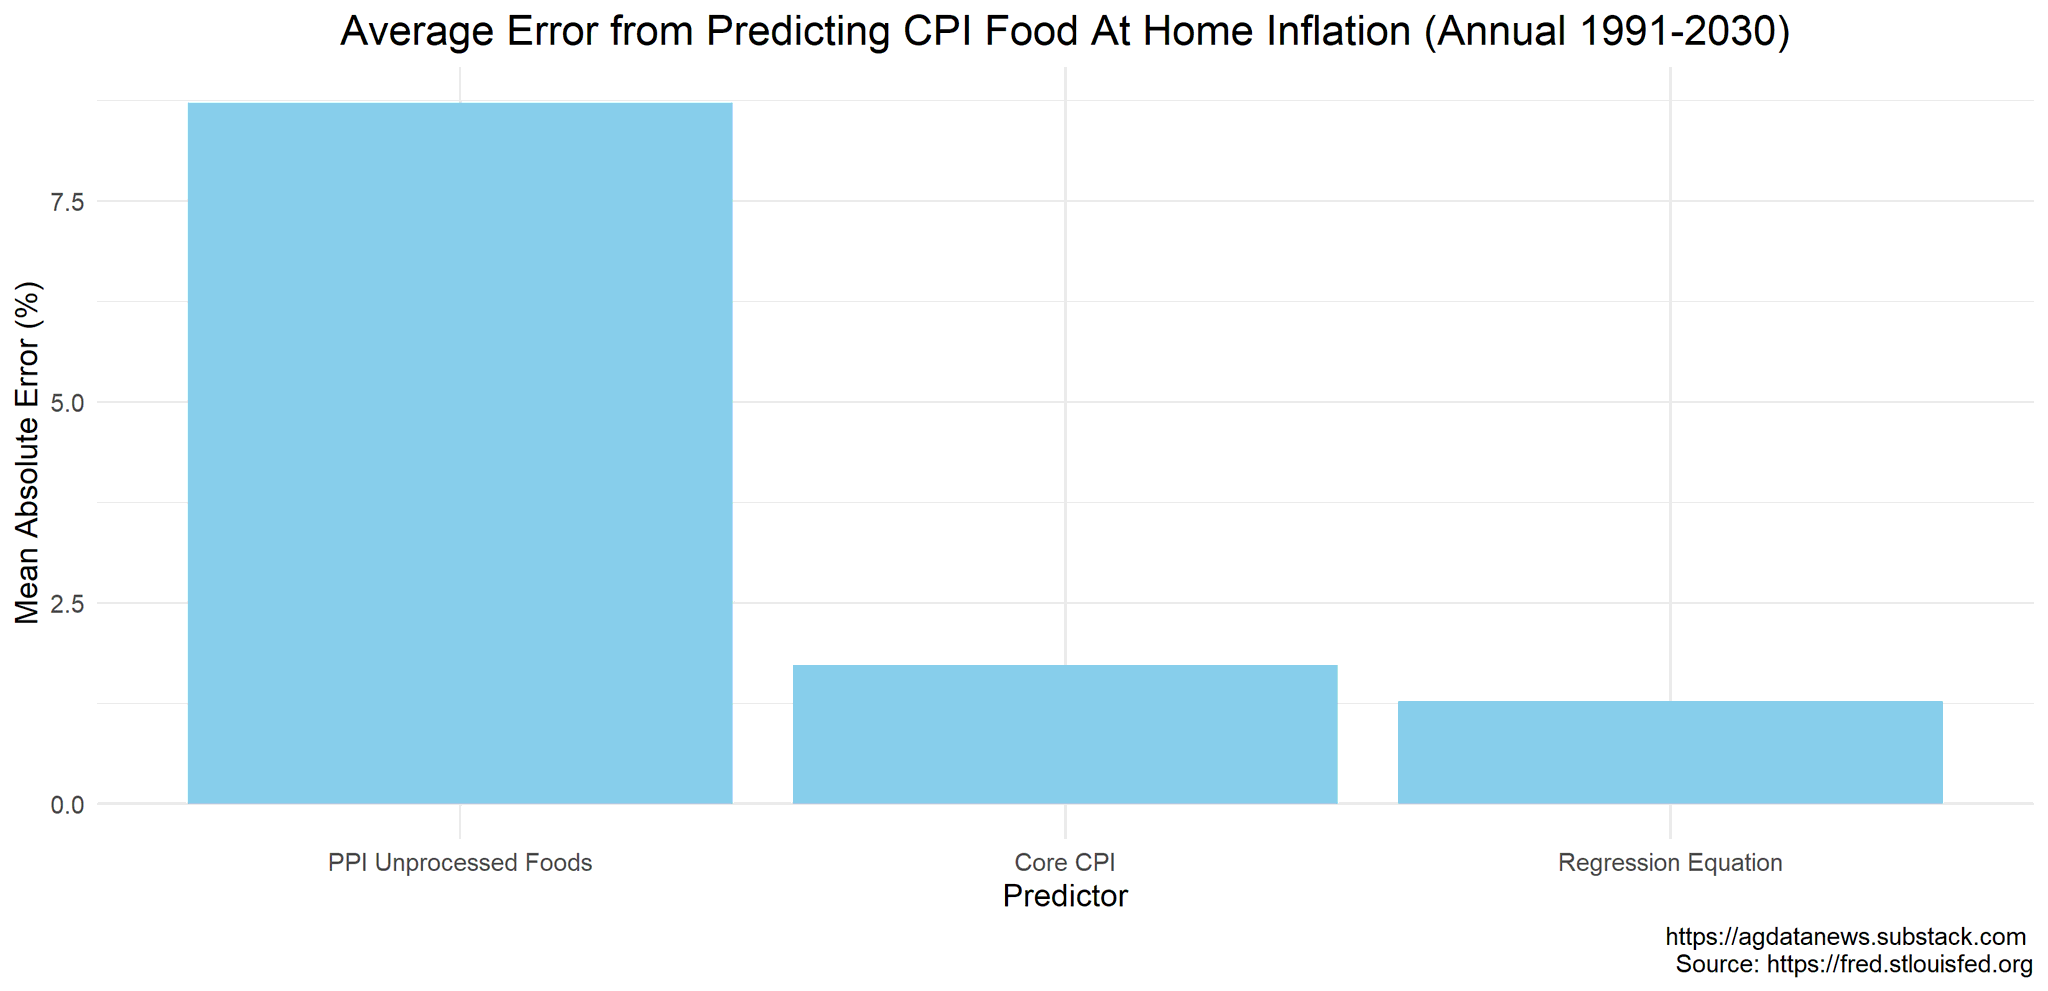

19. The USDA estimates that farm gate sales of food commodities made up 16% of the retail value of food in 2020. If farm prices were to double, we would expect food in the grocery store to increase by just 16%. data.ers.usda.gov/reports.aspx?ID=17885
20. These numbers vary across commodities. If you are buying minimally processed food like milk, eggs, or fresh vegetables, then the prices in the store will be more closely tied to the farm price. But, on average , the core CPI is better indicator of price trends. 

21. Core CPI went up 0.6% last month, 3.4% in the past six months, and 6.7% in the past year. These numbers all point to annual inflation of 6-7% in the near future, until Federal Reserve interest rate increases begin to bite.
22. But there is good news. As prices for unprocessed food come down, which they will at some point, the gap between food prices and core CPI will close. This means food prices are likely to grow more slowly than prices in the rest of the economy in the next year or two. 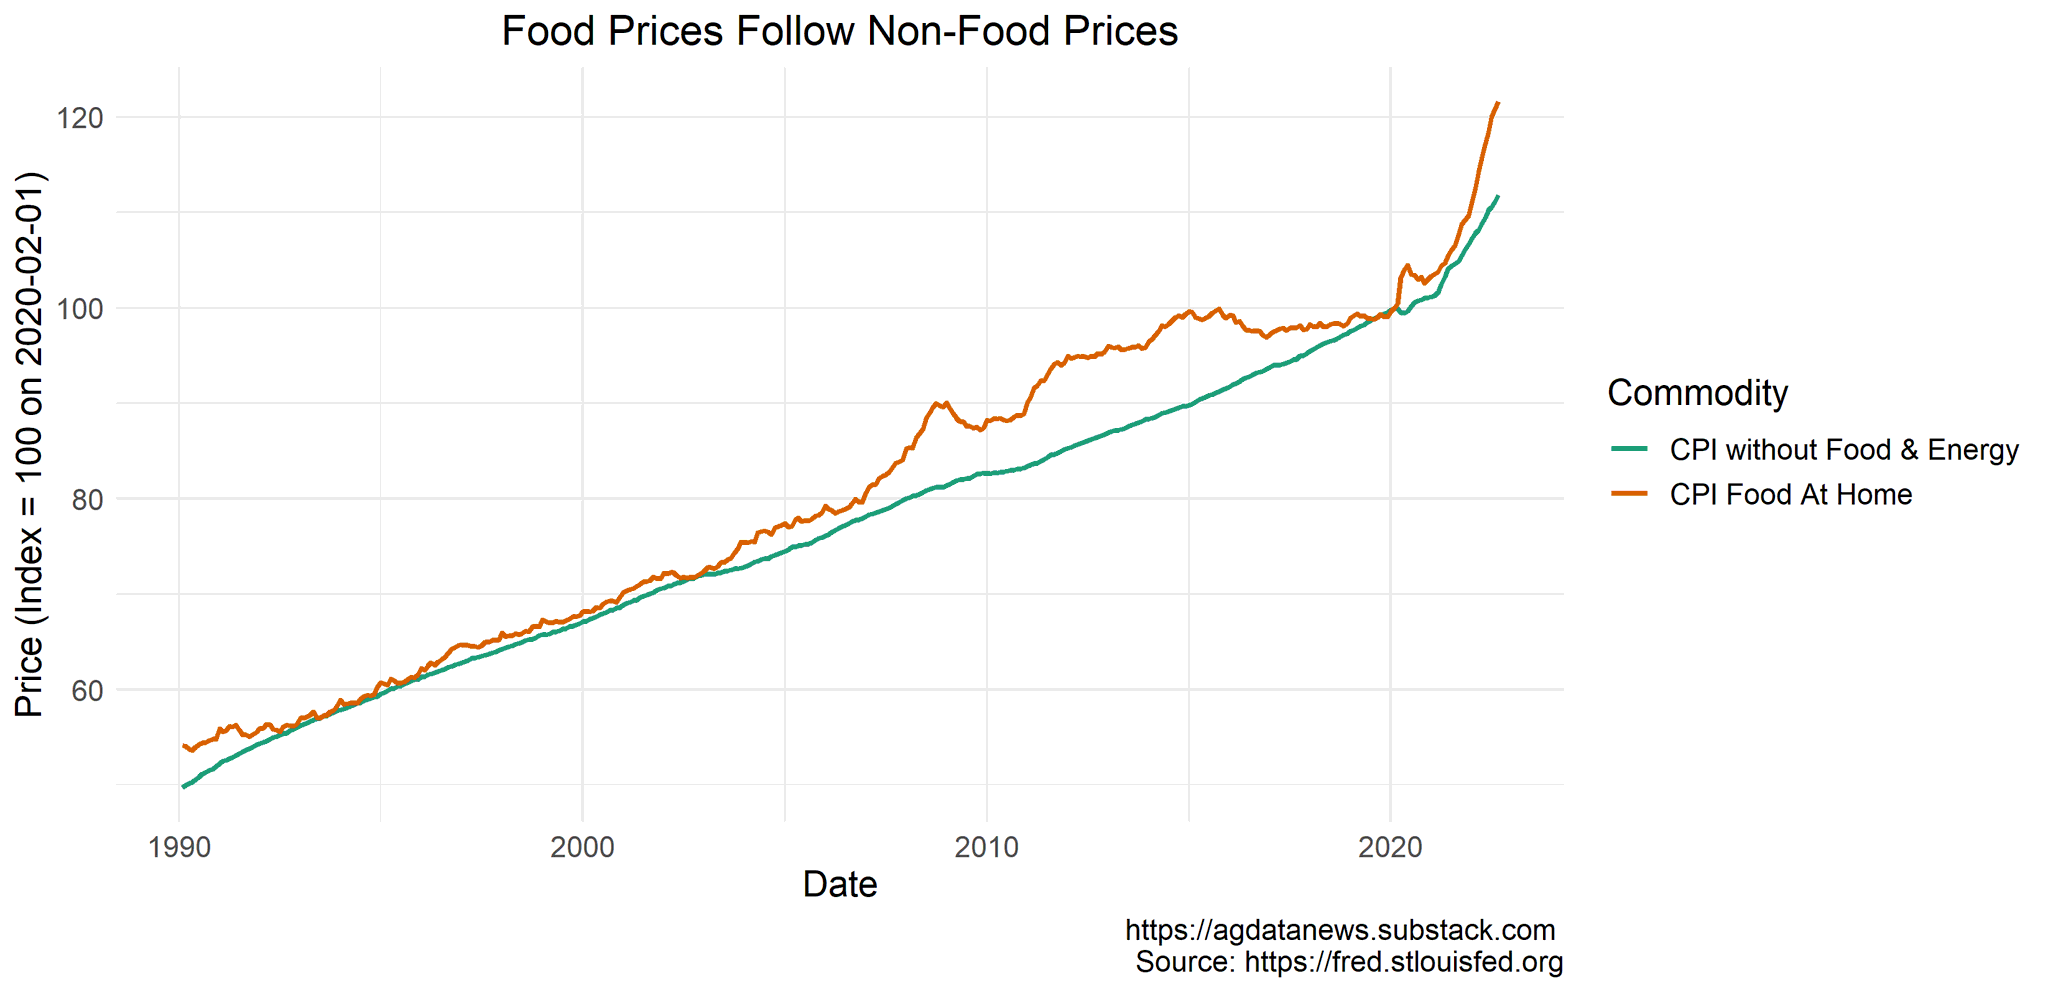

23. I made the graphs and estimated the prediction model in this article using this R code. files.asmith.ucdavis.edu/inflation_2022.R
Once more, a link to the article.
open.substack.com/pub/agdatanews/p/agricultural-prices-arent-driving?r=i2qe&utm_campaign=post&utm_med...
Once more, a link to the article.
open.substack.com/pub/agdatanews/p/agricultural-prices-arent-driving?r=i2qe&utm_campaign=post&utm_med...