Thread
The Bitcoin monetary network, ambivalent to the machinations of central bank policy, continues to grow stronger by the day. But with macro driving the marginal buyer of all risk assets lets explore the subtle global liquidity cues which will could forewarn of a cycle low 🧵
Despite the worst macro environment in decades, #BTCs hash-rate has hit a new all-time high, demonstrating a resilience that the fiat system has been short in throughout 2022. 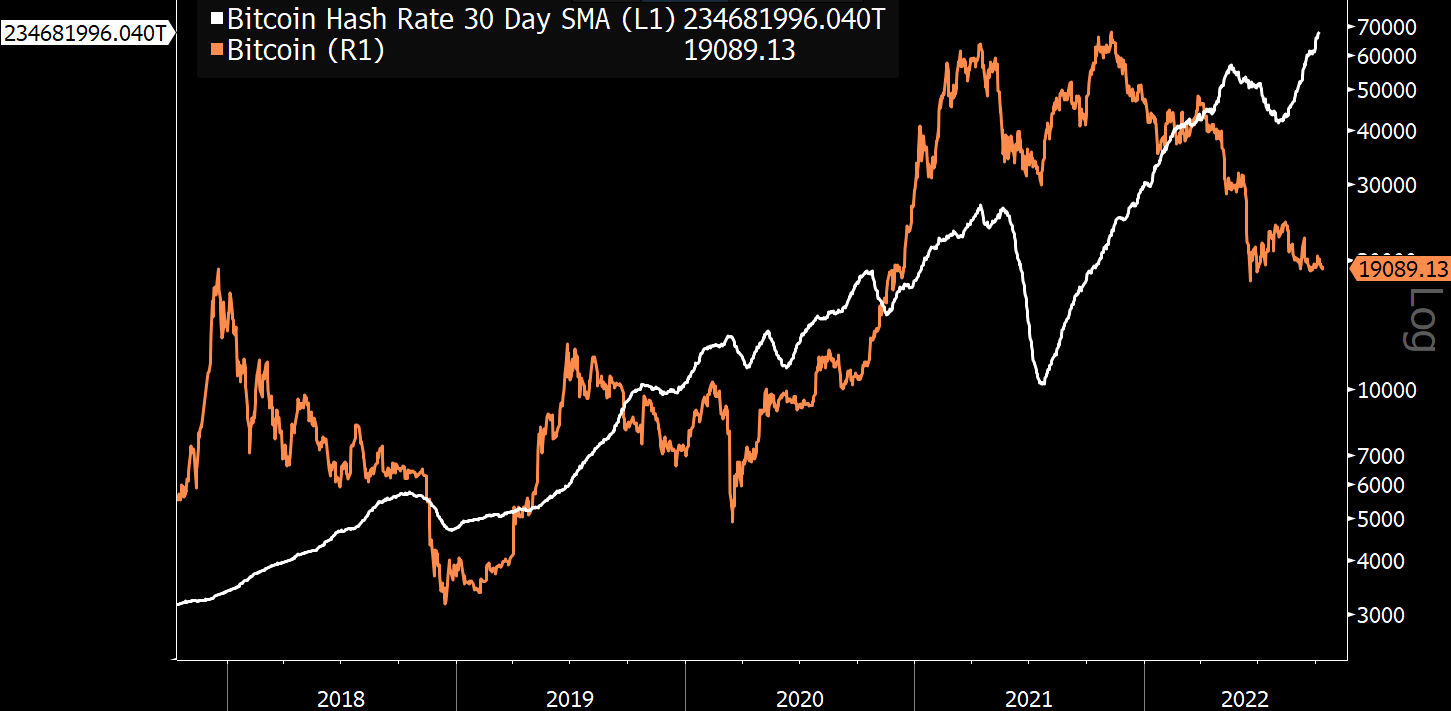

Institutions have effectively withdrawn $700b + from the financial system, preferring to park it with the Fed than risk it in the short term lending markets. This is 3x the liquidity withdrawal from the Fed via quantitative tightening.
hat tip @CryptoHayes for this framework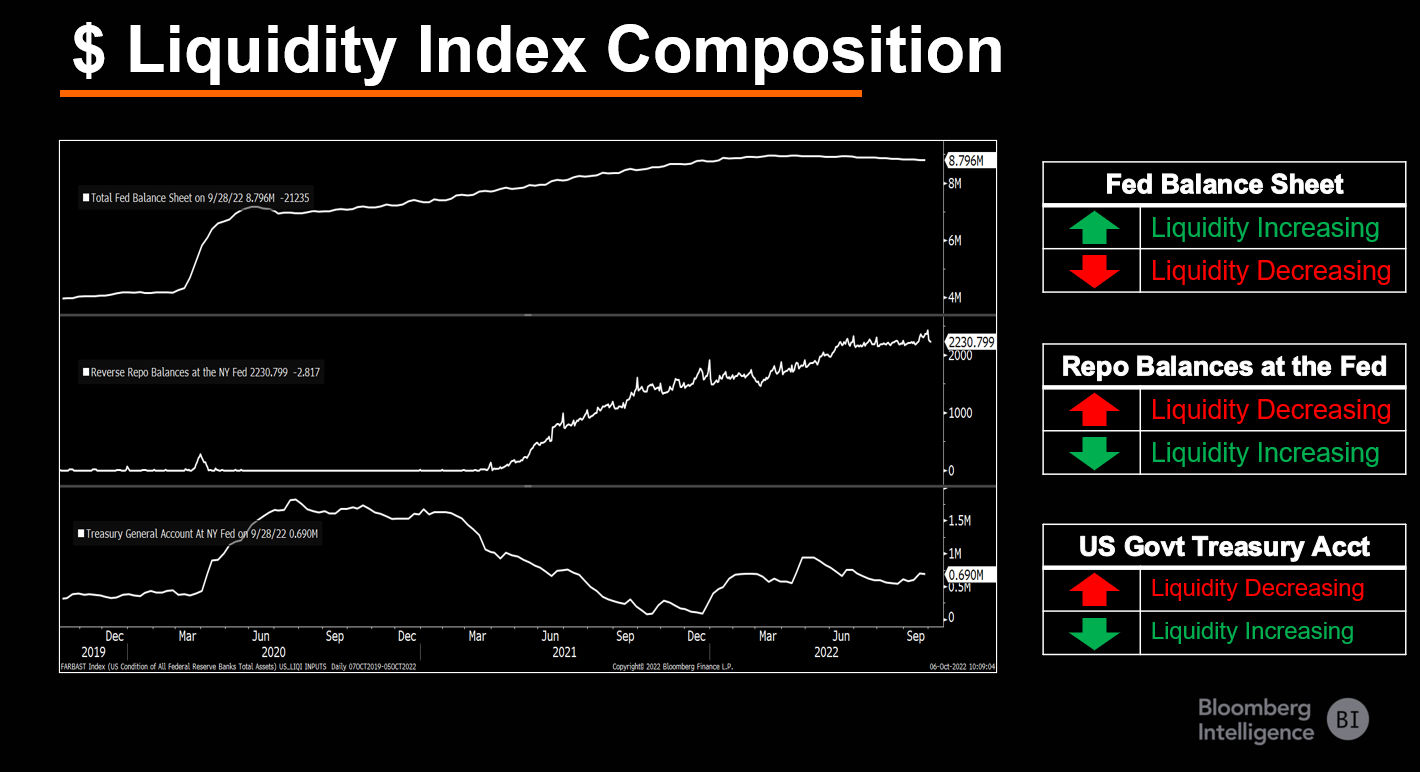
hat tip @CryptoHayes for this framework

@CryptoHayes Our regime filter captures the broad trend in US liquidity conditions (subchart). Current Bearish regime at 10mths is the 2nd most prolonged tightening and largest in magnitude with approx. $1.2T drained from the system since Dec-2022 (2x 2018/19 tightening). 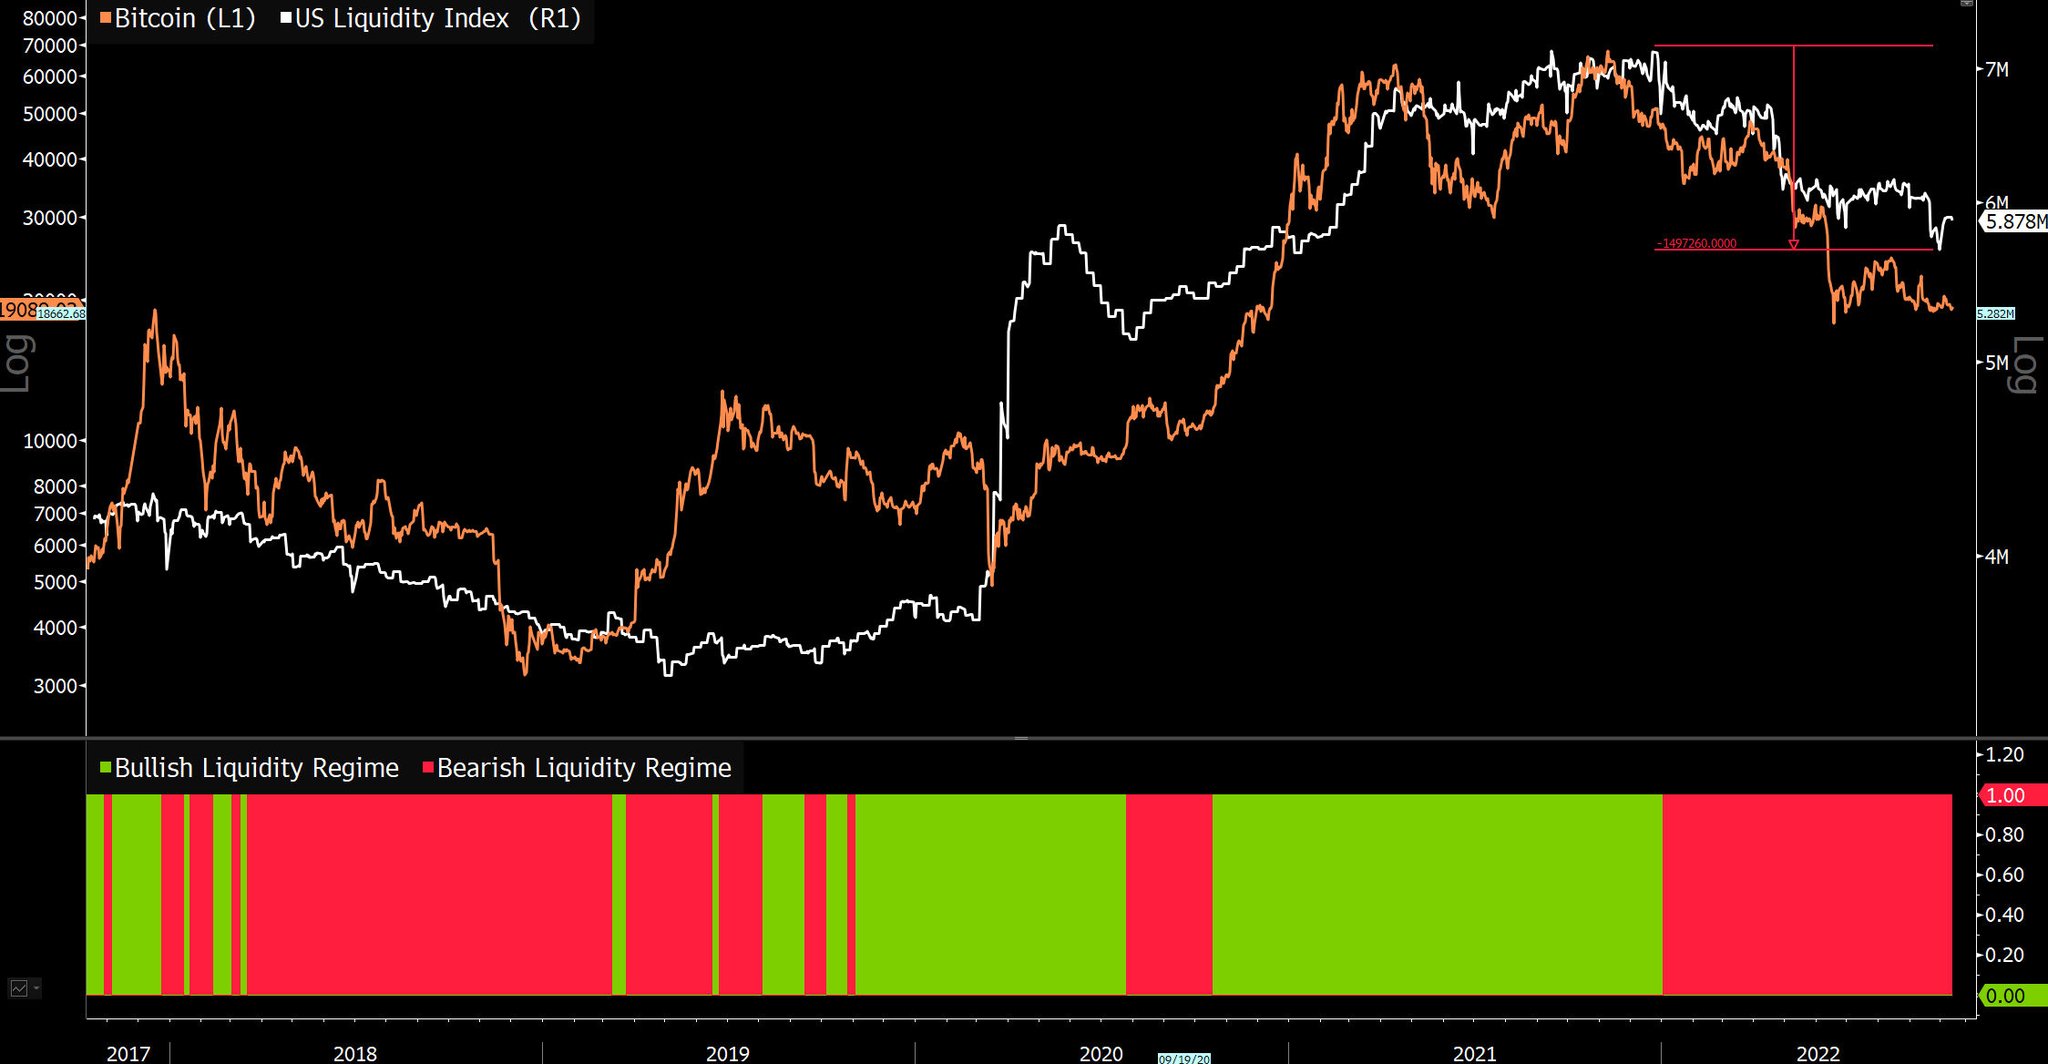

@CryptoHayes In the last cycle, #BTC bottomed in Dec-2018, months before Fed ended QT & the liquidity regime flipped bullish. I expect something similar to play out again 

@CryptoHayes While the regime filter wont identify exact tops/bottoms in US financial liquidity it does a solid job of identifying most optimal time for allocating to BTC/Crypto.
TL;DR - Bullish regimes have positive return skew and vice versa.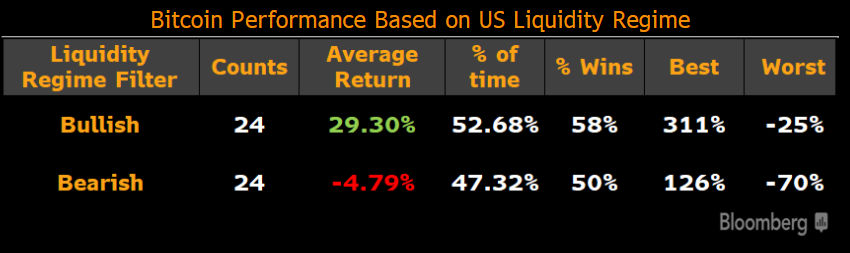
TL;DR - Bullish regimes have positive return skew and vice versa.

@CryptoHayes Lets look beyond US & add global money supply (M2) into the mix -- our custom index of the 13 of the largest economies' has contracted by 7.47% ($7T). Of the top 5, most of the tightening has come from local currencies depreciating & not M2 contraction (only US M2 is down YTD) 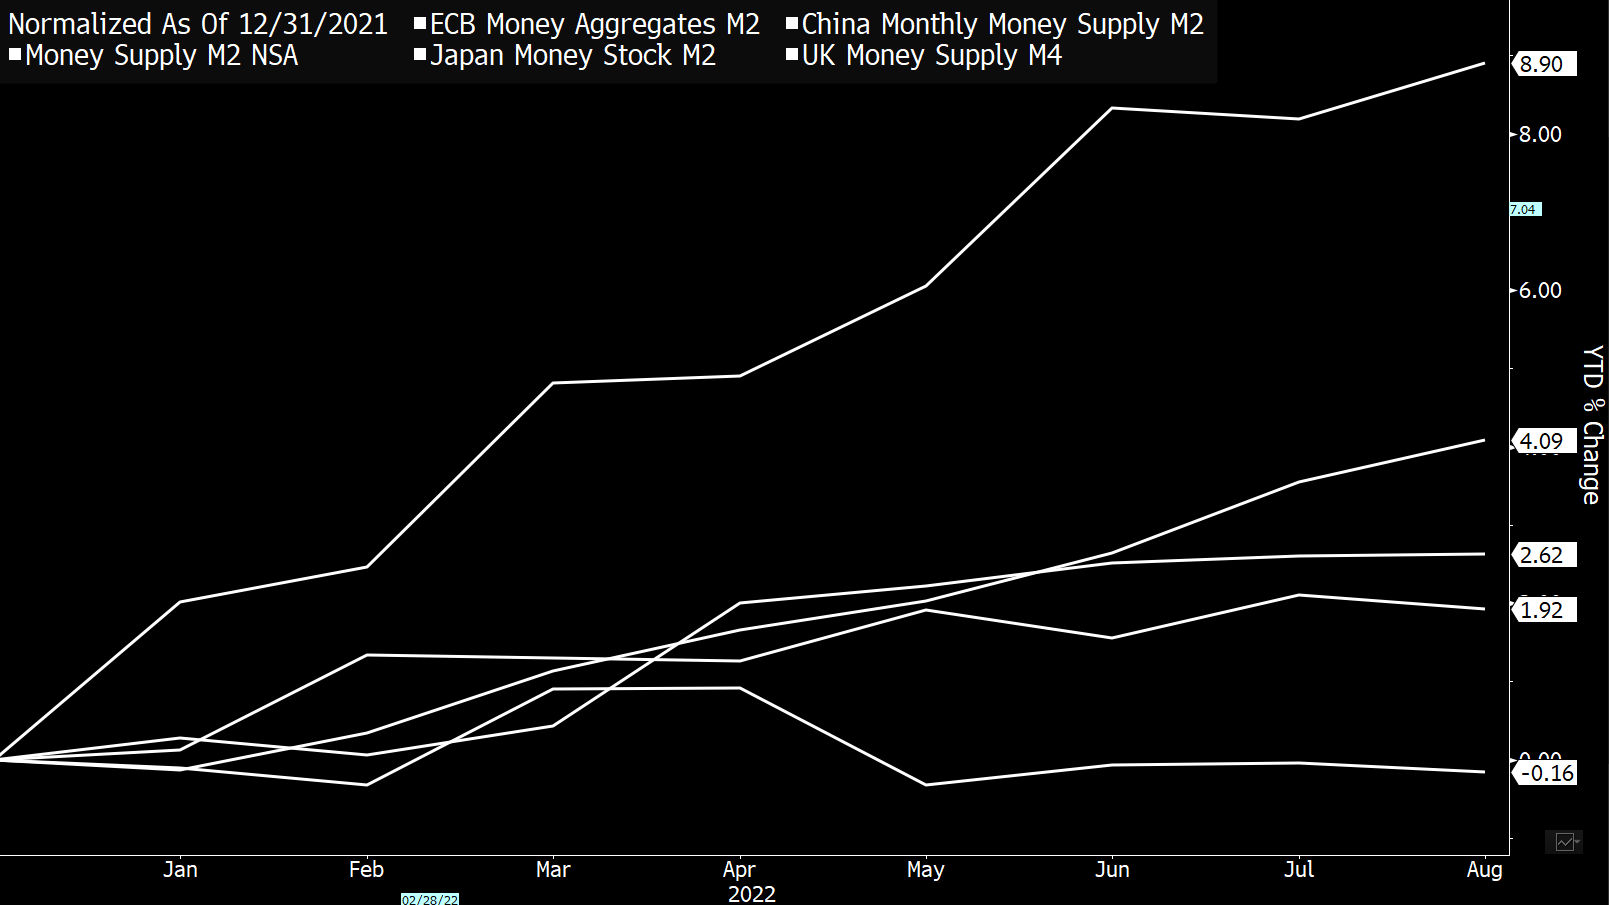

@CryptoHayes During the last cycle low, the bottom for Bitcoin formed when the global money supply index started to rise (ie M2 ⬆️ and/or USD ⬇️ ). Currently global money supply is net negative 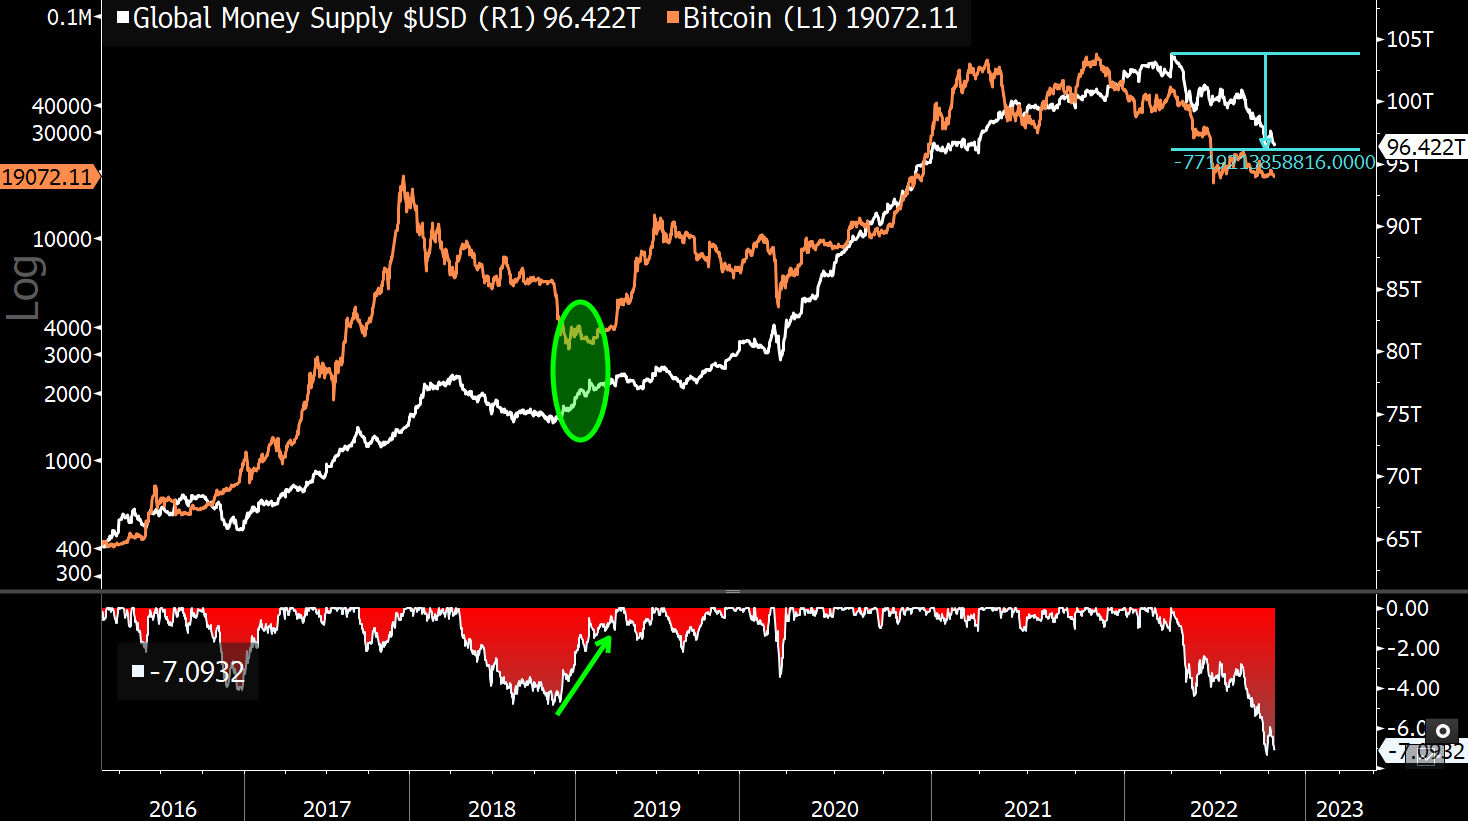

@CryptoHayes Using my colleague @mikemcglone11 chart we can see a temporal relationship between Bitcoin's price relative to its own 10-month moving average (orange) and the 12-month change in global money supply (white) -- worth watching this going fwd 👀 

@CryptoHayes @mikemcglone11 After trading at the most extreme discount to its 10-month moving average, #BTC's price since July has found support with price momentum starting to reverse after being sharply negative all year. 

@CryptoHayes @mikemcglone11 In previous cycles, this has been the setup for a cycle low. BTC vs its moving average reverses up approx. 1-6 months before the rate-of-change of global money supply starts its reversal. Usually before other assets - "Bitcoin is the last functioning fire alarm" @LukeGromen 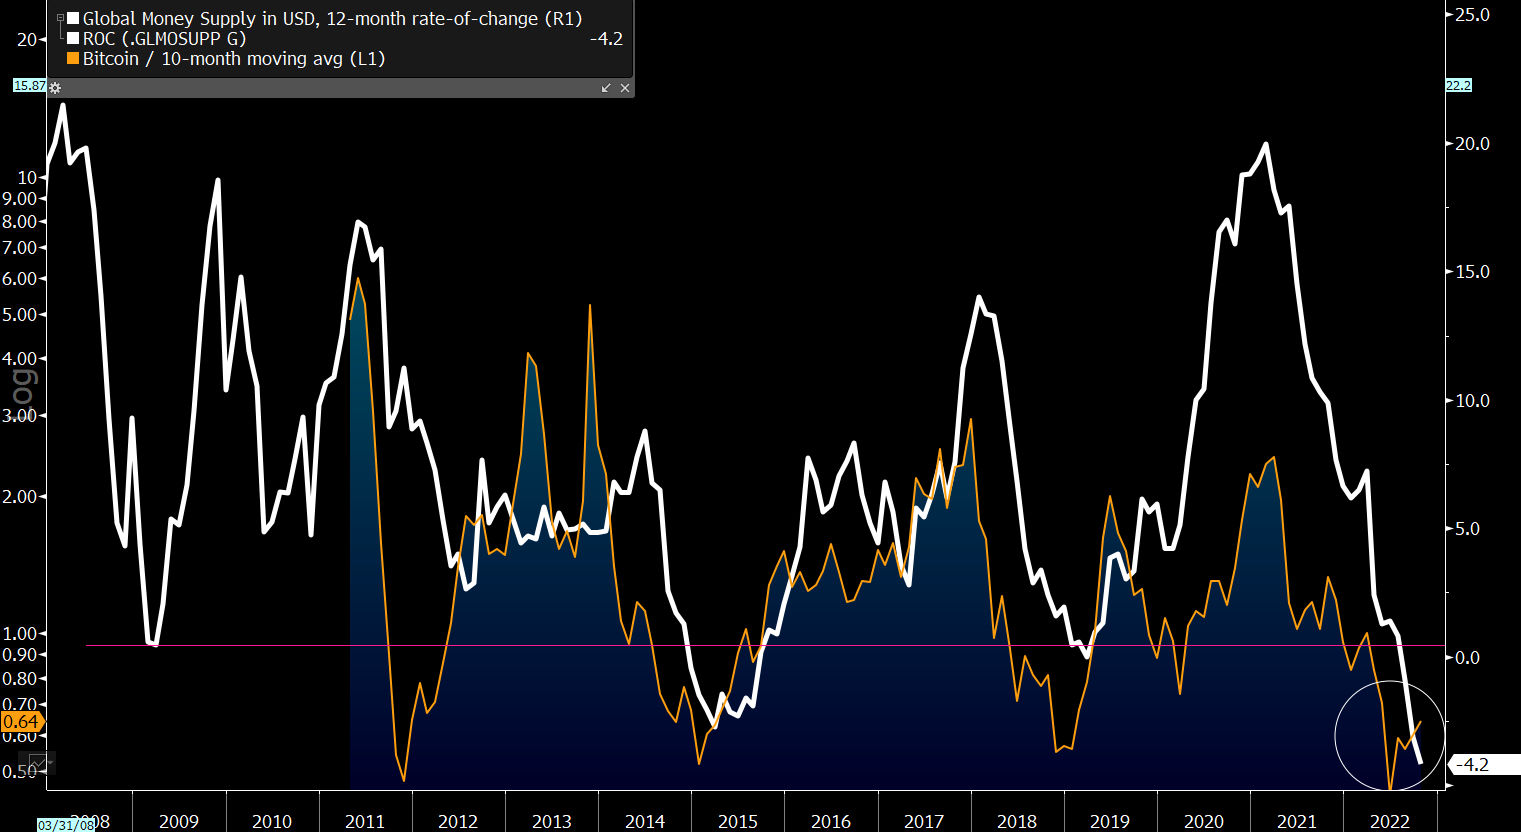

@CryptoHayes @mikemcglone11 @LukeGromen Money Supply Momentum Improving -- assuming relationship holds, improving M2 momentum should provide a critical signal that #BTC has found a cycle low. The system we have developed to identify inflection points uses a 3 & 12-month rate-of-change crossover 

@CryptoHayes @mikemcglone11 @LukeGromen Although the system is currently showing a signal for October, we would need to wait til the end of month for validation. If we take another leg lower, the signal will be invalidated and we will have to wait further 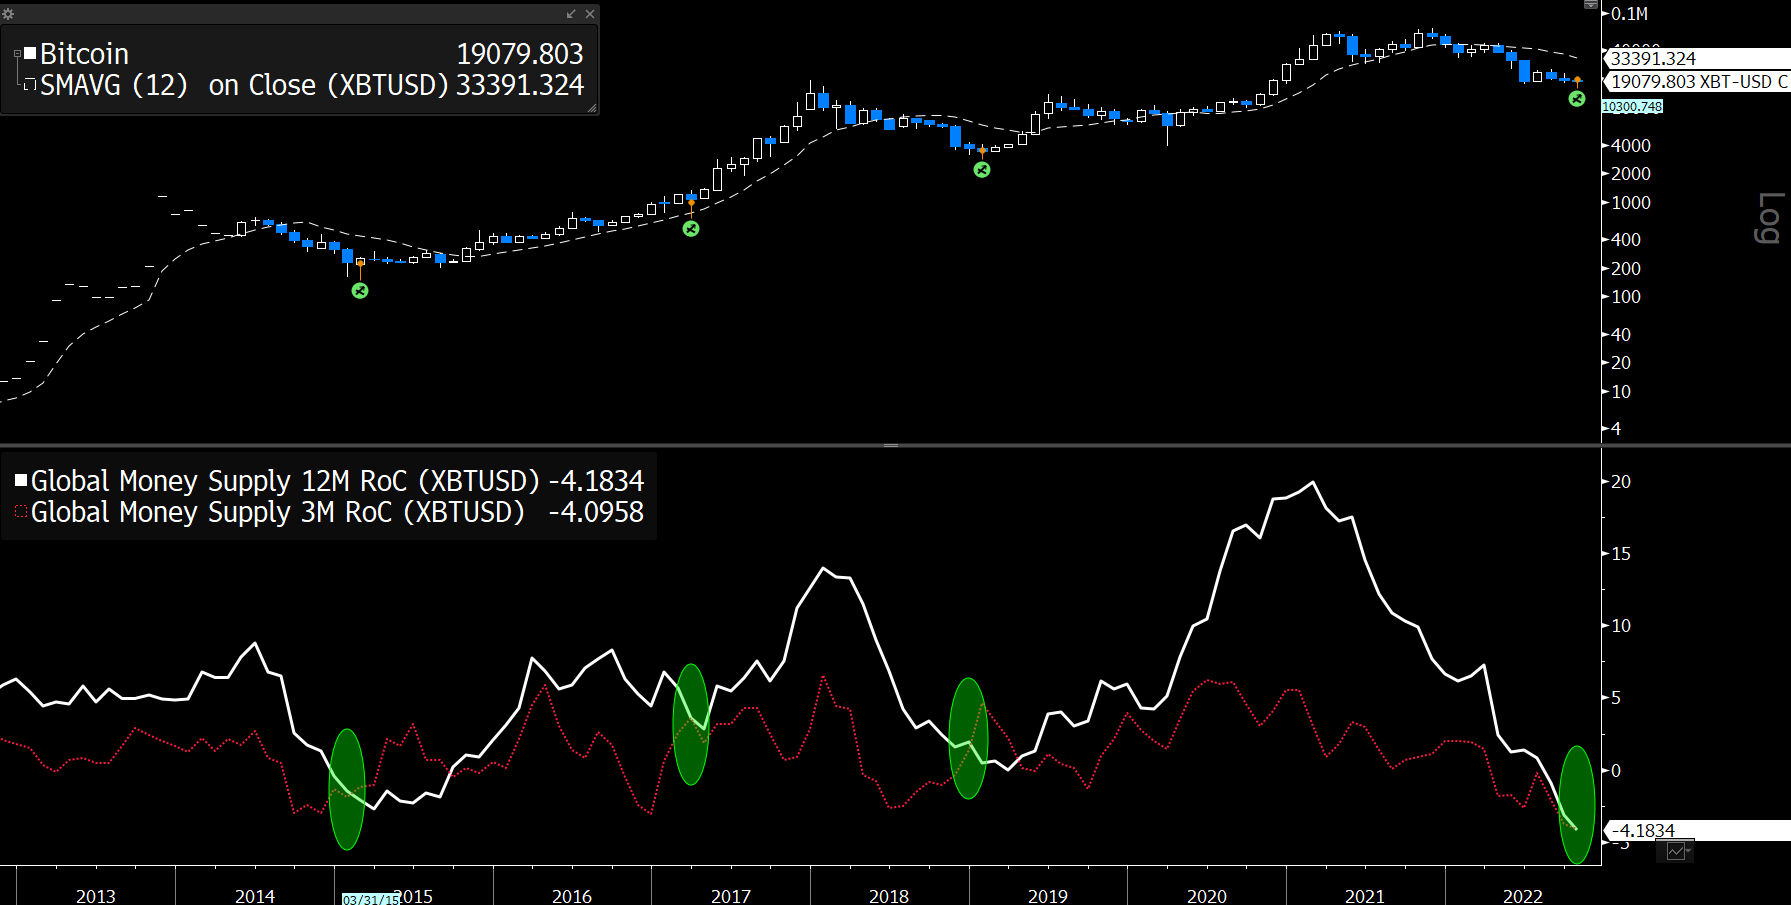

@CryptoHayes @mikemcglone11 @LukeGromen Bottom Line: With every day of CB distortion, BTC, the network & asset becomes more valuable and validated. But for timing purposes, both the US liquidity and Global Money Supply indexes should provide the necessary clues for a tradable long term low for #BTC