Thread
Today, I'm going to teach you about Cash Flow Variance Analysis.
It's a tool to help you understand the CASH DRIVERS of a business.
It also reveals if a business consumes OR generates cash as it grows (important).
You won't analyze a company without it.
Let's go!
It's a tool to help you understand the CASH DRIVERS of a business.
It also reveals if a business consumes OR generates cash as it grows (important).
You won't analyze a company without it.
Let's go!

1/ Setting The Stage
There are two inputs for our Cash Flow Variance Analysis:
- Operating Cushion
- Working Capital Requirements
You can read more about each of those at the link below.
macro-ops.com/cash-flow-its-all-that-matters-pt-2/
Let's start w/ Operating Cushion.
There are two inputs for our Cash Flow Variance Analysis:
- Operating Cushion
- Working Capital Requirements
You can read more about each of those at the link below.
macro-ops.com/cash-flow-its-all-that-matters-pt-2/
Let's start w/ Operating Cushion.
2/ Operating Cushion (OC)
OC = Gross Margin % - SG&A %.
Two things to remember:
- The > the OC: the MORE cash a company will generate as it grows top-line revenue
- The < the OC: the LESS cash a company will generate as it grows top-line revenue
Why does this matter?
OC = Gross Margin % - SG&A %.
Two things to remember:
- The > the OC: the MORE cash a company will generate as it grows top-line revenue
- The < the OC: the LESS cash a company will generate as it grows top-line revenue
Why does this matter?
3/ Why is Operating Cushion Important? ...
OC is important because not all revenue growth is created equal.
Growth that creates value should command higher valuations from the market.
Growth that destroys value (I.e., consumes > cash) should garner a lower multiple.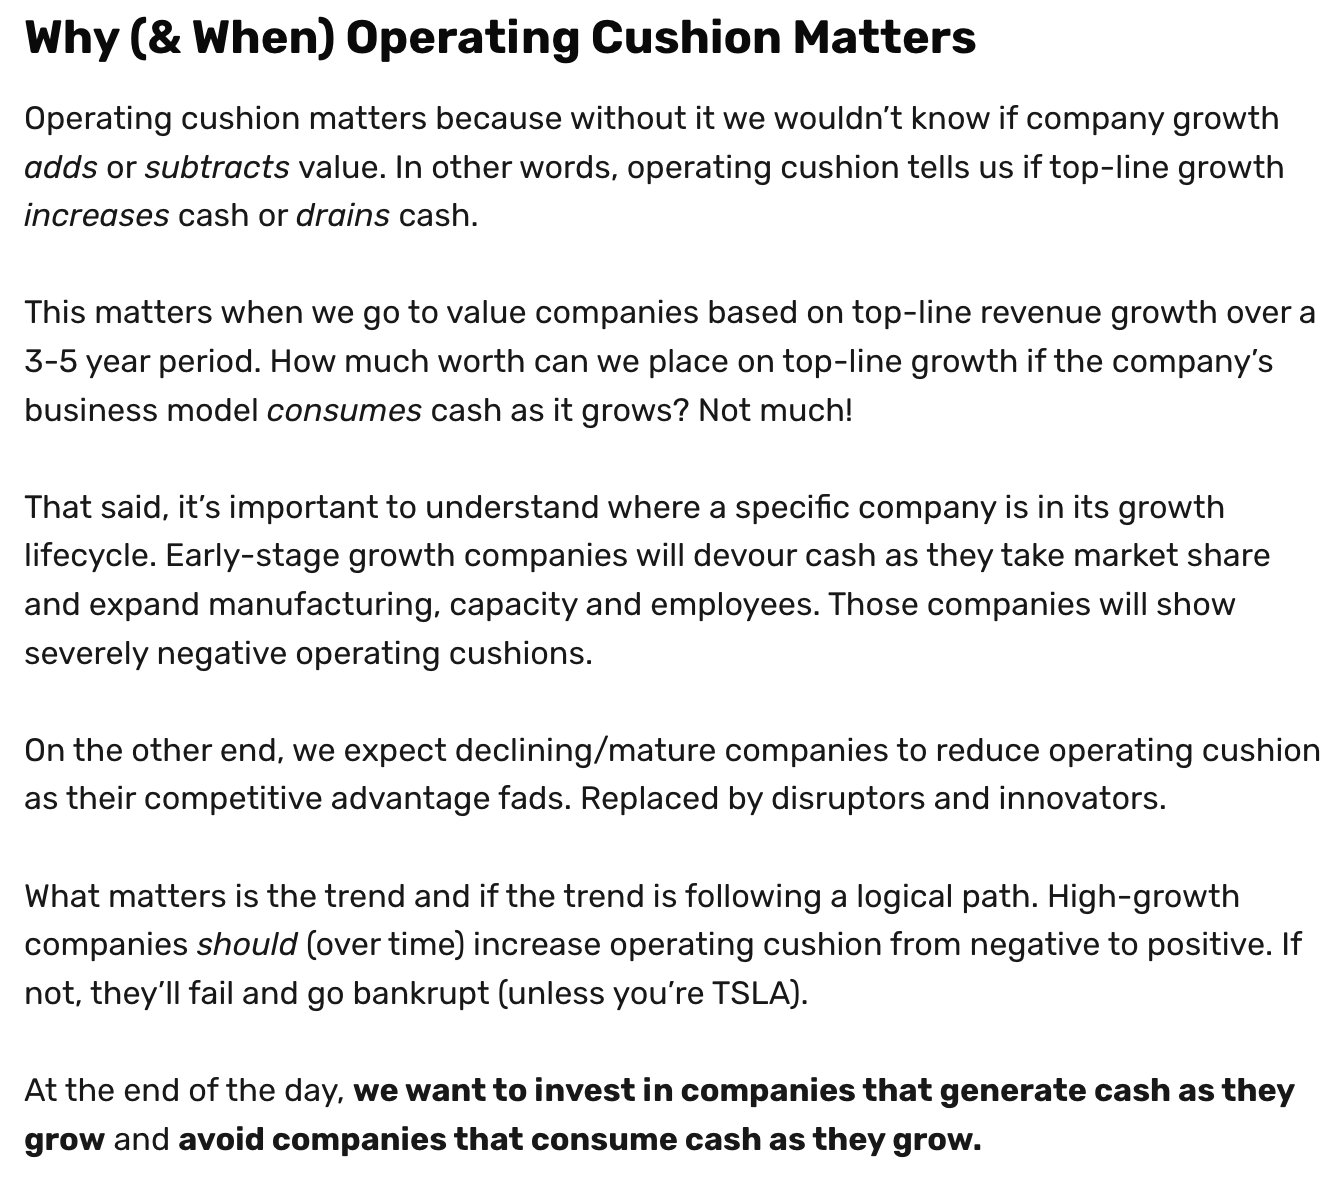
OC is important because not all revenue growth is created equal.
Growth that creates value should command higher valuations from the market.
Growth that destroys value (I.e., consumes > cash) should garner a lower multiple.

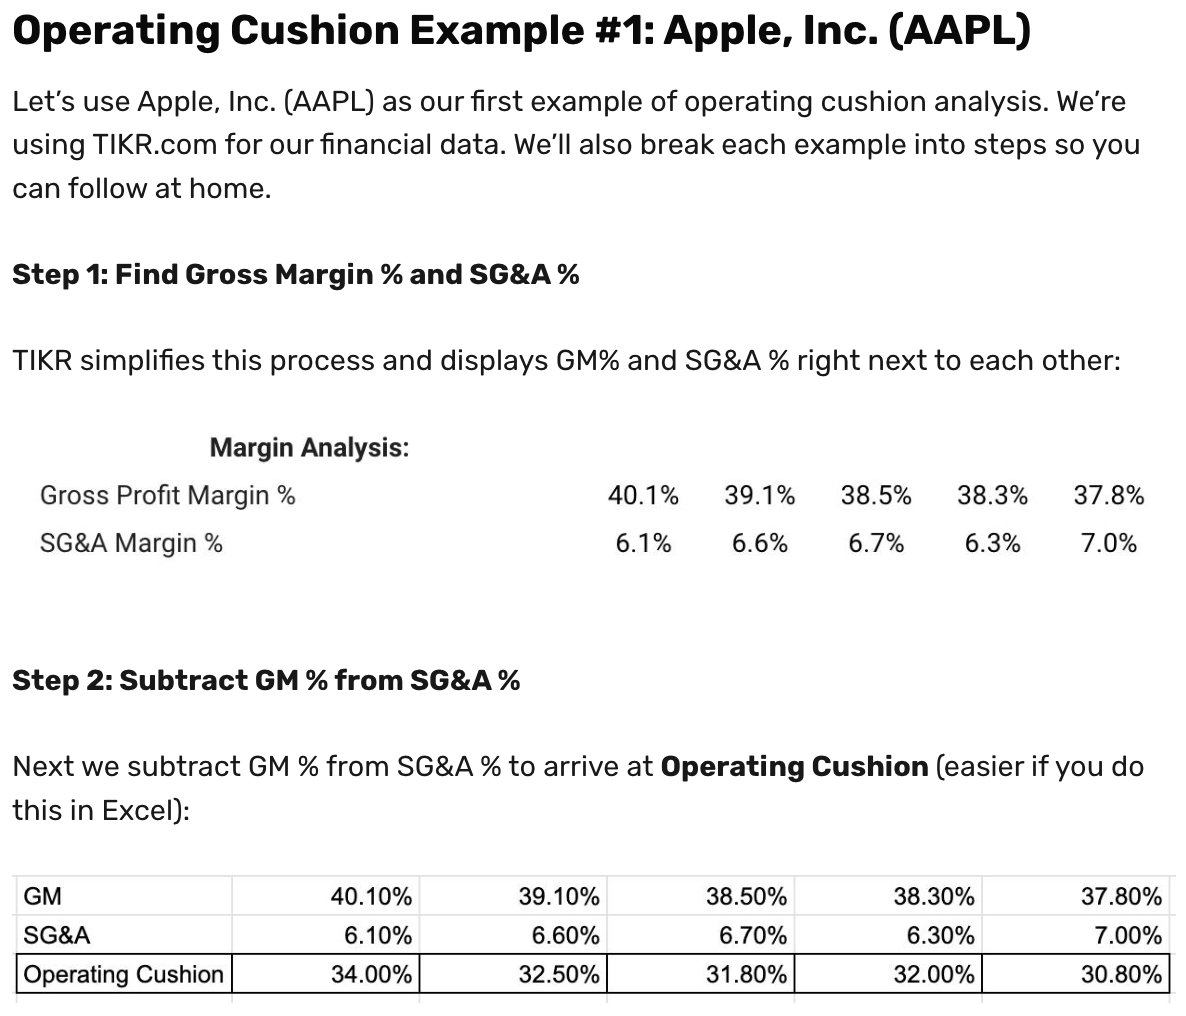
4/ Example: Apple $AAPL
Let's analyze $AAPL's 5YR OC Trend (left to right).
There are two things that stick out:
1) Gross margin % decline
2) SG&A % increase
These two factors have led to a DECREASE in OC from 34% to 30%.
In other words, fewer $ from revenue growth.
Let's analyze $AAPL's 5YR OC Trend (left to right).
There are two things that stick out:
1) Gross margin % decline
2) SG&A % increase
These two factors have led to a DECREASE in OC from 34% to 30%.
In other words, fewer $ from revenue growth.
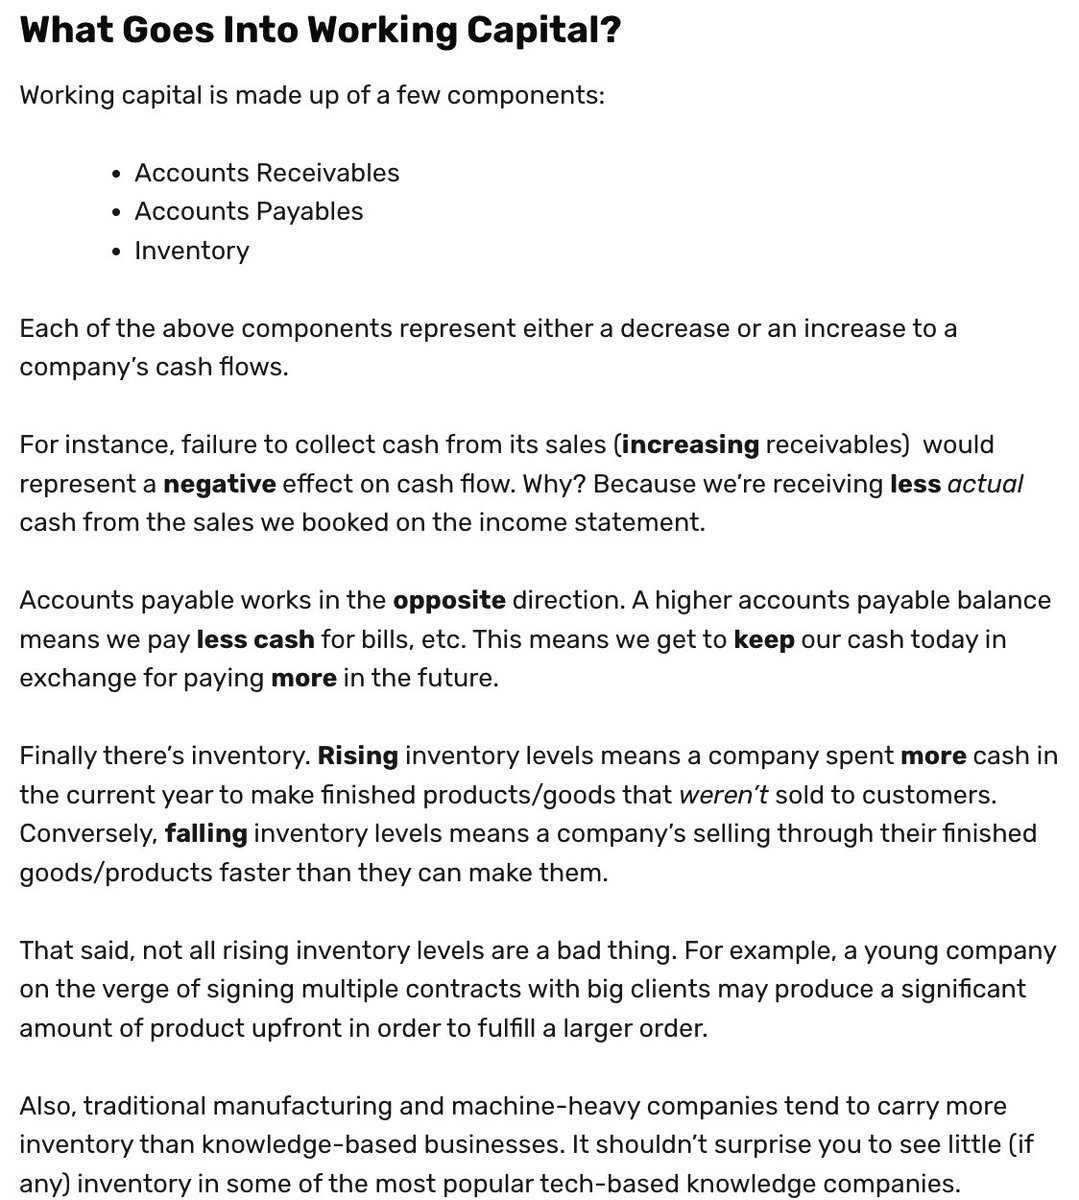
5/ Introducing: Working Capital (WC) Requirements
It takes CASH to grow revenues. Some companies require more than others.
This is called Working Capital. It's composed of:
- Accounts Receivable (A/R)
- Account Payable (A/P)
- Inventory
- Deferred Revenue
Cont...
It takes CASH to grow revenues. Some companies require more than others.
This is called Working Capital. It's composed of:
- Accounts Receivable (A/R)
- Account Payable (A/P)
- Inventory
- Deferred Revenue
Cont...
6/ Working Capital Cont ...
Each component either drains or generates cash. For example:
Cash Generators: Rising A/P and Deferred Revenue, Declining A/R and Inventory
Cash Drains: Declining A/P and Deferred Revenue, Rising A/R and Inventory
Note: Check company lifecycle!
Each component either drains or generates cash. For example:
Cash Generators: Rising A/P and Deferred Revenue, Declining A/R and Inventory
Cash Drains: Declining A/P and Deferred Revenue, Rising A/R and Inventory
Note: Check company lifecycle!
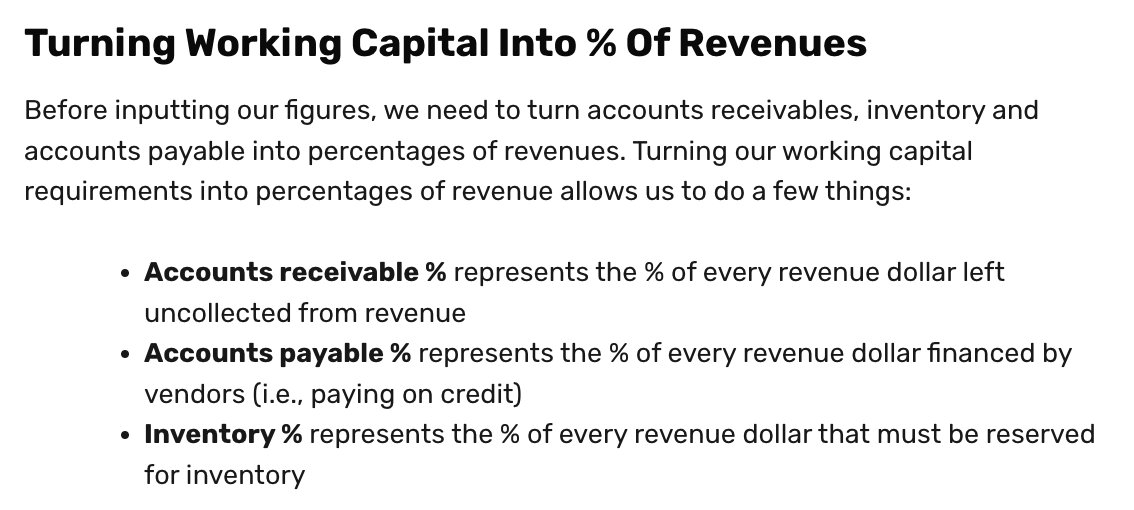
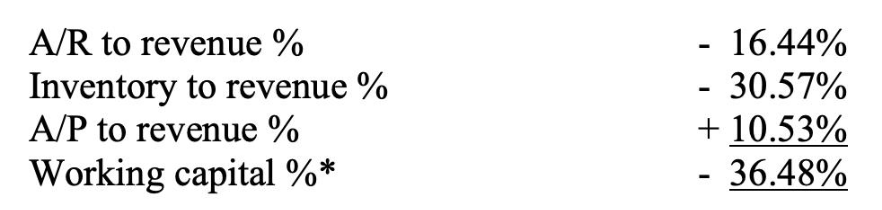
7/ Turning Working Capital Into Percentages
Turning WC into % of revenue offers a clearer picture on how much we extract (or consume) in working capital from each dollar of revenue gained.
Let's put the finishing pieces together.

Turning WC into % of revenue offers a clearer picture on how much we extract (or consume) in working capital from each dollar of revenue gained.
Let's put the finishing pieces together.
8/ Core Operating Growth Profile (COGP): Bringing It Together
COGP = Operating Cushion % - WC %
Let's use our $AAPL example from 2019.
- OC: 30.80%
- WC: -1.43%
That gives us 29.37% in COGP.
In other words, $AAPL generated $0.29 in OCF for every $1 in revenue growth.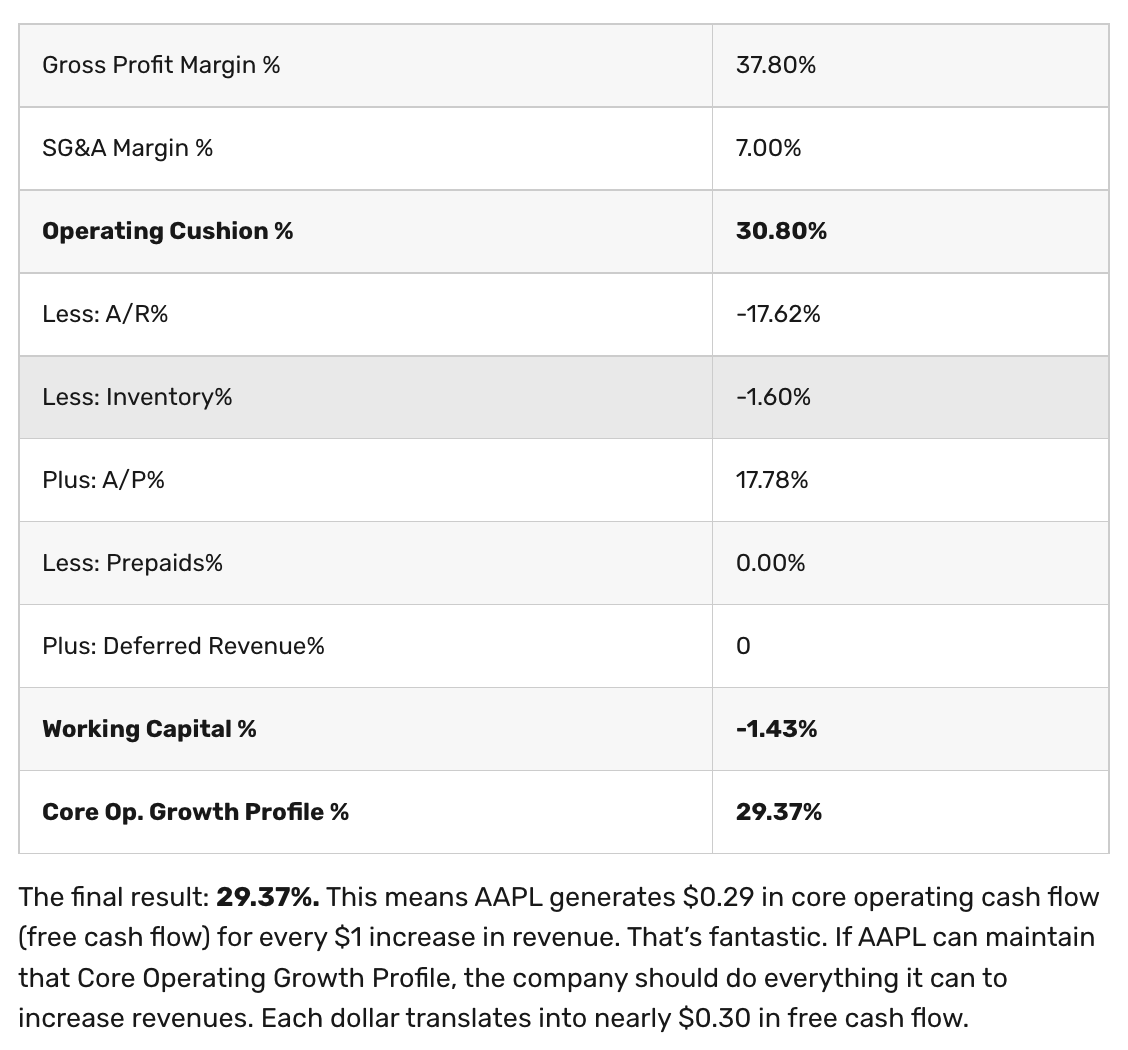
COGP = Operating Cushion % - WC %
Let's use our $AAPL example from 2019.
- OC: 30.80%
- WC: -1.43%
That gives us 29.37% in COGP.
In other words, $AAPL generated $0.29 in OCF for every $1 in revenue growth.

9/ Wrapping Up
Operating Cushion and COGP allow us to answer three questions:
1) How easily does a company generate cash?
2) Does the company spend loads of $ to grow?
3) How much FCF does a company generate from its revenue growth?
Remember: Always follow the cash!
Operating Cushion and COGP allow us to answer three questions:
1) How easily does a company generate cash?
2) Does the company spend loads of $ to grow?
3) How much FCF does a company generate from its revenue growth?
Remember: Always follow the cash!
10/ Further Reading
If you enjoyed this thread, check out our two-part series on Cash Flow Variance Analysis here:
macro-ops.com/cash-flow-its-all-that-matters/
Also, download the original academic paper on the topic here: nacm.org/pdfs/gscfm/CashFlowAnalysis.pdf
If you enjoyed this thread, check out our two-part series on Cash Flow Variance Analysis here:
macro-ops.com/cash-flow-its-all-that-matters/
Also, download the original academic paper on the topic here: nacm.org/pdfs/gscfm/CashFlowAnalysis.pdf