Thread
1/ The NFT Market is a Fat Man
🧵
🧵
2/ Illiquid markets move like a fat man.
A fat man will take a while to make a move.
slow, heavy, but with strong convexity—every movement accentuates its own momentum.
A fat man will take a while to make a move.
slow, heavy, but with strong convexity—every movement accentuates its own momentum.
3/ Why? To get a sense, let’s first look at liquid markets.
4/ The Minksy model is a well known explanation for the reflexivity and inherent instability of public financial markets.
Each part of the cycle is self-reinforcing and therefore takes time to play out: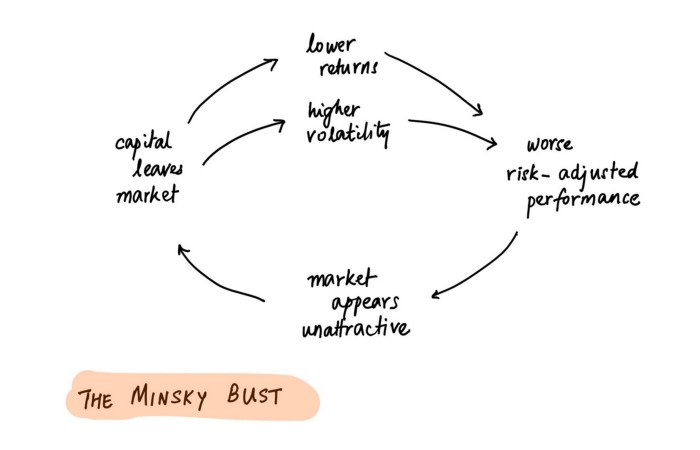
Each part of the cycle is self-reinforcing and therefore takes time to play out:

(illustration by @athomasq)
5/ The transition to the ‘bust’ stage of the cycle is first triggered by excess speculation and profit-taking.
Then, it is characterized by capital leaving the market—>lower returns—>higher volatility—>worse risk-adjusted returns—>capital leaving—>..
5/ The transition to the ‘bust’ stage of the cycle is first triggered by excess speculation and profit-taking.
Then, it is characterized by capital leaving the market—>lower returns—>higher volatility—>worse risk-adjusted returns—>capital leaving—>..
6/ One of the main culprits is ‘high volatility’, but is it true for illiquid markets like NFTs?
I’d argue it’s not—in fact, I would expect volatility to lower as capital leaves the market during the reflexive ‘bust’ stage.
I’d argue it’s not—in fact, I would expect volatility to lower as capital leaves the market during the reflexive ‘bust’ stage.
7/ Surprisingly, I’ve never seen anyone measure aggregate volatility in NFT markets.
For anecdotal evidence beyond my personal observation, let's look at data published last week by @punk9059: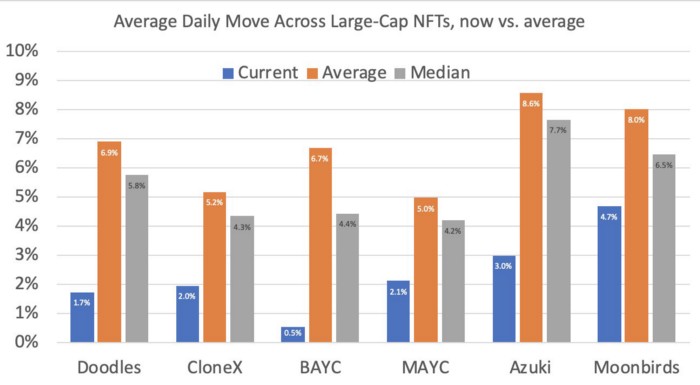
For anecdotal evidence beyond my personal observation, let's look at data published last week by @punk9059:

8/ Volatility (measured here by daily price movement) has in fact noticeably decreased recently, along with volumes.
Contrast that to liquid financial market—where liquidity and volatility generally have an inverse correlation.
What does it mean? Well,
Contrast that to liquid financial market—where liquidity and volatility generally have an inverse correlation.
What does it mean? Well,
9/ In a traditional Minsky bust, increasing volatility would support and accelerate the bust.
In illiquid NFT markets, decreasing volatility dampens and slows the reflexivity to the downside.
Hence, fat man.
In illiquid NFT markets, decreasing volatility dampens and slows the reflexivity to the downside.
Hence, fat man.
10/ The years 2006–2009 paint this picture well.
Against a backdrop of abundant capital, speculation and complex debt products—the art market saw amazing growth.
Let’s not focus on why it grew when it did (i leave this to you, reader) but instead on *when the it stopped*.
Against a backdrop of abundant capital, speculation and complex debt products—the art market saw amazing growth.
Let’s not focus on why it grew when it did (i leave this to you, reader) but instead on *when the it stopped*.
11/ The S&P500 topped in October 2007.
Looking back at volume of art transactions, we notice that growth continued during the 1st half of 2008, mildly tapered off in the 2nd half, and finally fell off a cliff in 2009.
Looking back at volume of art transactions, we notice that growth continued during the 1st half of 2008, mildly tapered off in the 2nd half, and finally fell off a cliff in 2009.

12/ It took 8–12 months for the fat man to really start moving (down).
Let’s extrapolate this pattern to NFTs—note how similar the structure is:
Let’s extrapolate this pattern to NFTs—note how similar the structure is:

13/ Crypto markets topped in November 2021.
NFT volumes grew and sustained high levels for 6 months, but recently took a sharp downturn—with daily volume now consistently making new yearly lows.
NFT volumes grew and sustained high levels for 6 months, but recently took a sharp downturn—with daily volume now consistently making new yearly lows.
14/ If the anecdotal analogy to the 2008 GFC stands, our fat man won’t be getting up any time soon.
On the bright side, we'll soon get to see the corporate dinosaurs renounce their metaverse strategies. What a joy that would be.
On the bright side, we'll soon get to see the corporate dinosaurs renounce their metaverse strategies. What a joy that would be.
15/ It might not be what we want, but it’s what we need.
There’ll be amazing opportunities once the dust settles. It might take a long time, though, and patience is crucial.
There’ll be amazing opportunities once the dust settles. It might take a long time, though, and patience is crucial.
16/ For the past 2 years, we have been conditioned to act swiftly or else opportunity slips away.
Hyperactivity was rewarded. It’s time to transition back. The best investments of the next cycle likely don’t even exist yet.
Pay attention, but be very slow to deploy.
Hyperactivity was rewarded. It’s time to transition back. The best investments of the next cycle likely don’t even exist yet.
Pay attention, but be very slow to deploy.
17/ It is extremely hard to keep your patience for years all the while maintaining a ‘scout mindset’. But I reckon it will be worth it.
Make room for the fat man to land.
Make room for the fat man to land.
