Thread by Michael Otsuka
- Tweet
- Jun 19, 2022
- #Inflation #PoliticalEconomy
Thread
Why @ucu & @UCEA1 should agree on "RPI-F" (RPI minus the difference between CPIH & RPI due to the "formula effect") as the best available proxy for the impact of inflation on university workers.🧵1/
A new Household Costs Index (HCI), now under development, is tailored to capture the effect of inflation on a typical UK household. It serves this purpose better than @UCEA1's preferred CPIH index in at least 2 significant respects👇. 2/
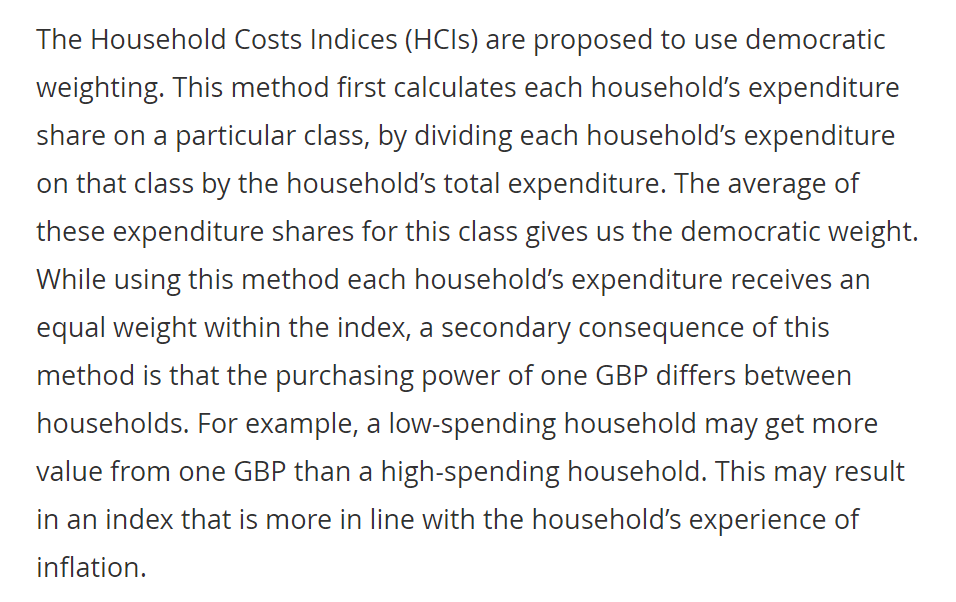
✅HCI weights the impact of inflation on each household equally, no matter how rich or poor its members & therefore how much they're able to spend on the purchase of goods. 3/
👎By contrast CPIH weights each pound spent equally & therefore gives greater weight to the greater spending of richer households. 4/
This is why CPIH is referred to as a 'plutocratic index', whereas HCI is called a 'democratic index'.👇Does it come as a surprise that VC's🤑💰are staunch defenders of the plutocratic index? 5/
www.ons.gov.uk/economy/inflationandpriceindices/methodologies/investigatingtheimpactofdifferentweight...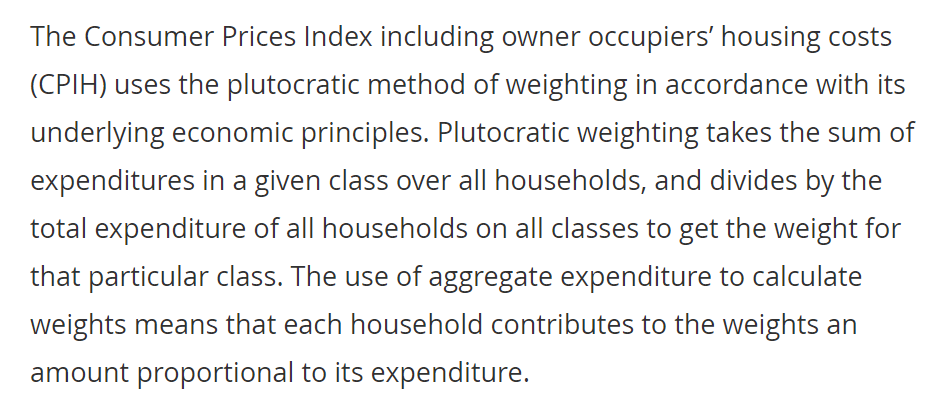
www.ons.gov.uk/economy/inflationandpriceindices/methodologies/investigatingtheimpactofdifferentweight...


✅HCI also includes the effect of rises & falls in interest rates for mortgages (& credit cards & student loans) on household spending.
👎CPIH excludes this & incorporates different means of trying to capture the costs of owning, maintaining & living in one's own home. 6/
👎CPIH excludes this & incorporates different means of trying to capture the costs of owning, maintaining & living in one's own home. 6/
Why doesn't CPIH simply include interest rates? Because CPIH constitutes the inflation target the Bank of England must meet by means of increases or decrease in interest rates. Hence there would be a double-counting negative feedback loop if interest rates were included in it. 7/
This relates to a more general point: CPIH is designed for the macroeconomic purposes served by BofE inflation targetting. HCI is designed to serve the different microeconomic purpose of assessing the impact of inflation on a typical household. 8/
HCI is based on proposals from the @RoyalStatSoc (CEO @stianwestlake), which has been a strong proponent of this index👇. 9/
rss.org.uk/RSS/media/File-library/News/2022/We%C2%AD_need_faster_development_of-_the_Household_Costs_...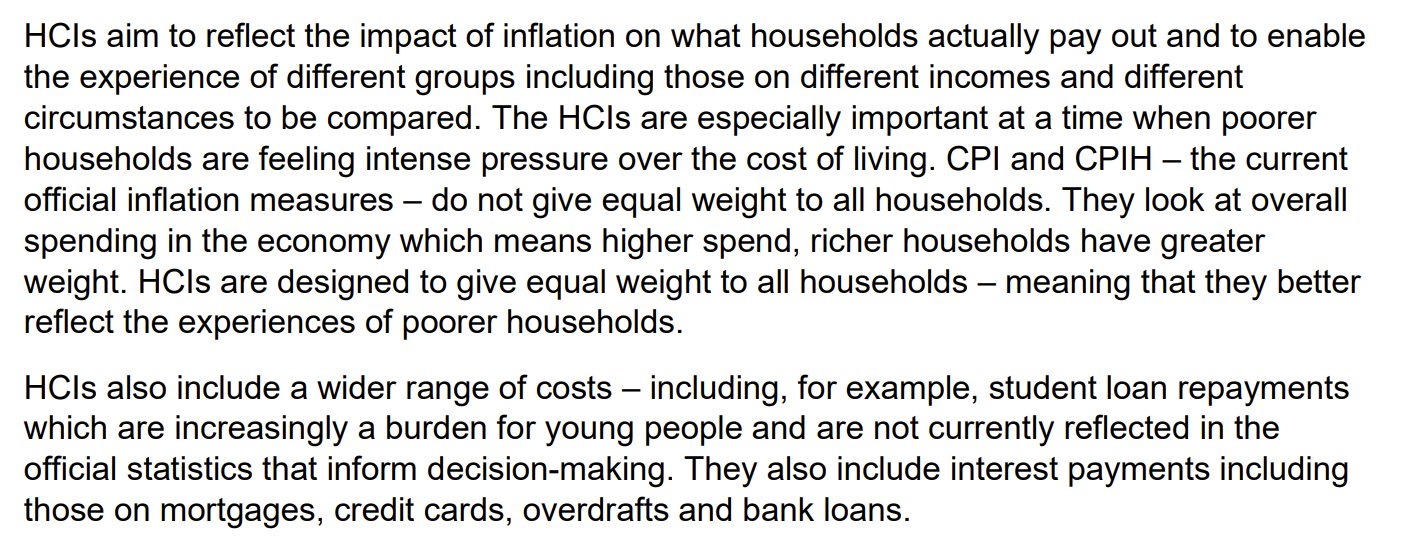
rss.org.uk/RSS/media/File-library/News/2022/We%C2%AD_need_faster_development_of-_the_Household_Costs_...

Unfortunately, HCI is still under development, extends only to Dec 2021 & will not be updated monthly in the near future. To get around this problem in the short term, @UCU & @UCEA1 should adopt an available measure which comes closest to HCI. 10/
Over the entire period from Feb 2006 to Dec 2021 for which HCI figures are now available, CPIH has been lower on average than HCI: 2.15% v 2.35%. 12/
CPIH has also run lower than HCI during the latest period for which HCI data is available: the 2nd half of 2021, when inflation started to take off. See graph👇. 13/ 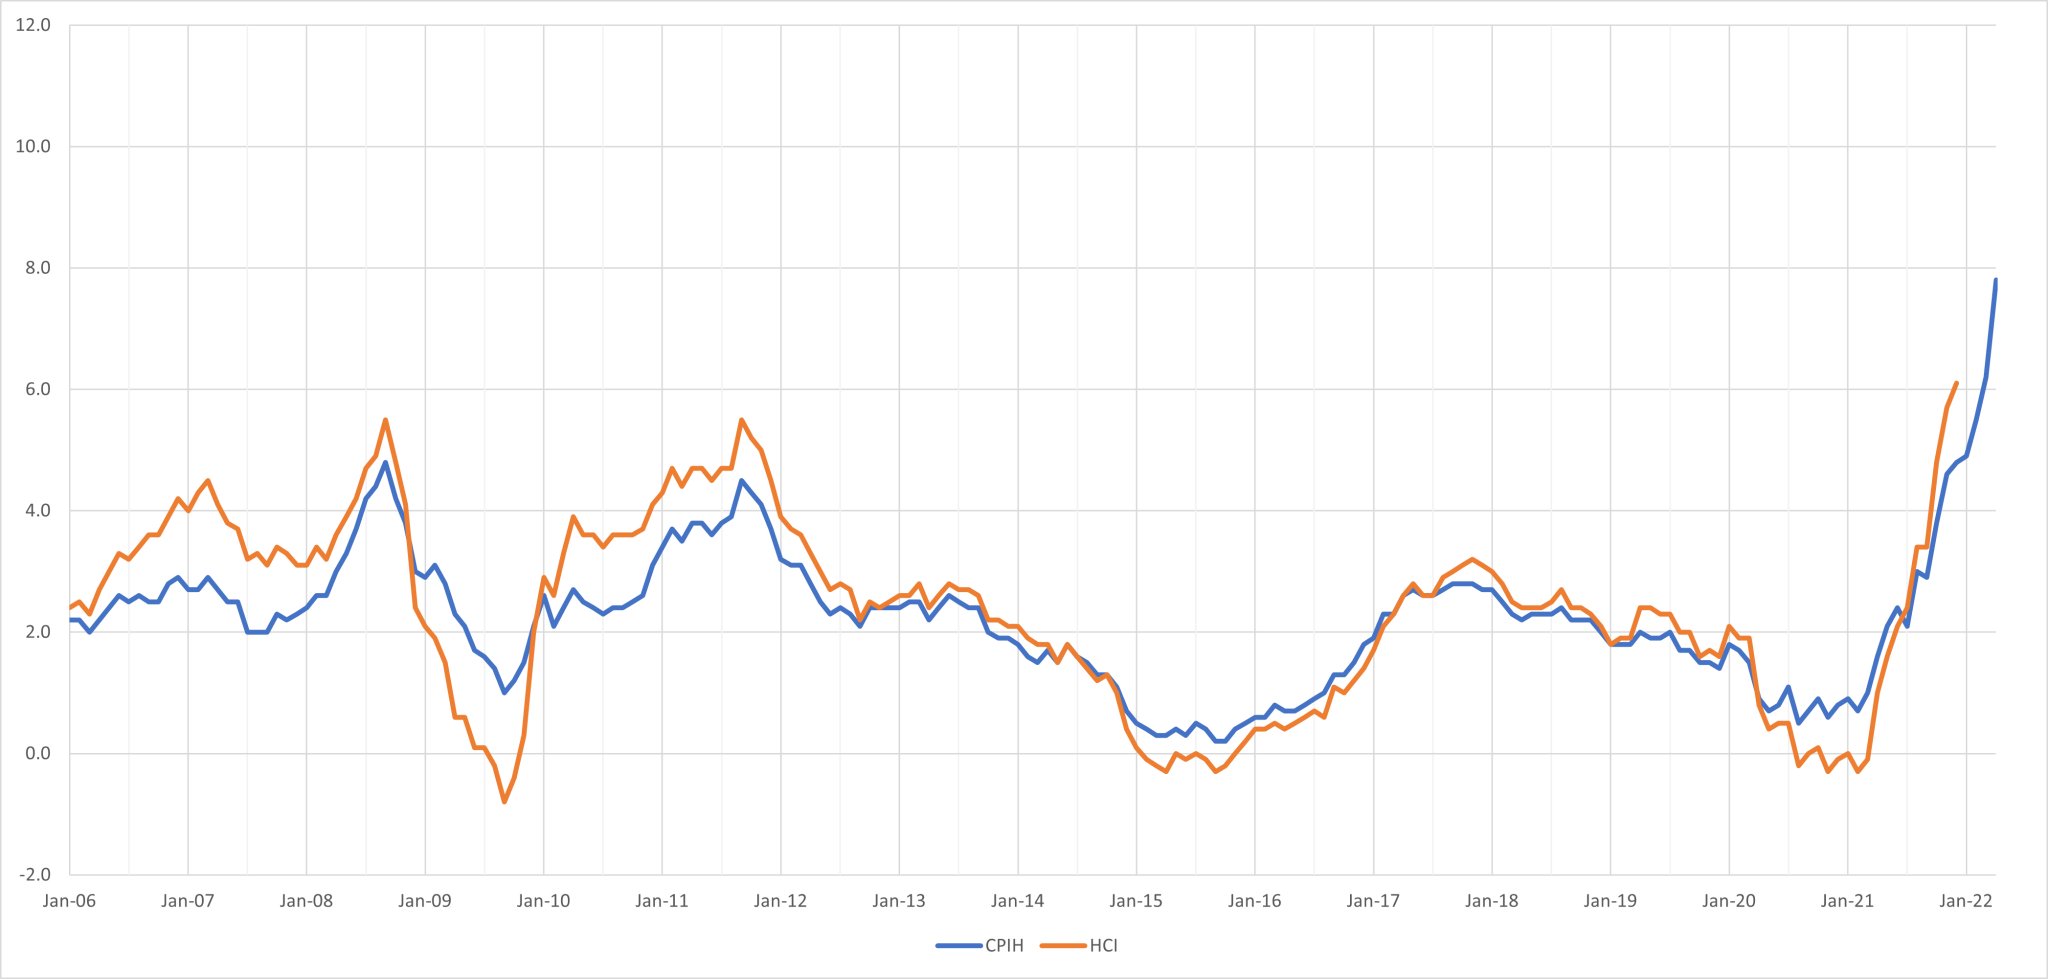

What about RPI v HCI? RPI has run higher on average than HCI during the 2006-21 period for which HCI data is available: 2.95% v 2.35%. RPI has also run higher than HCI at nearly every point throughout that period apart from during the global financial crisis of 08-09.👇 14/ 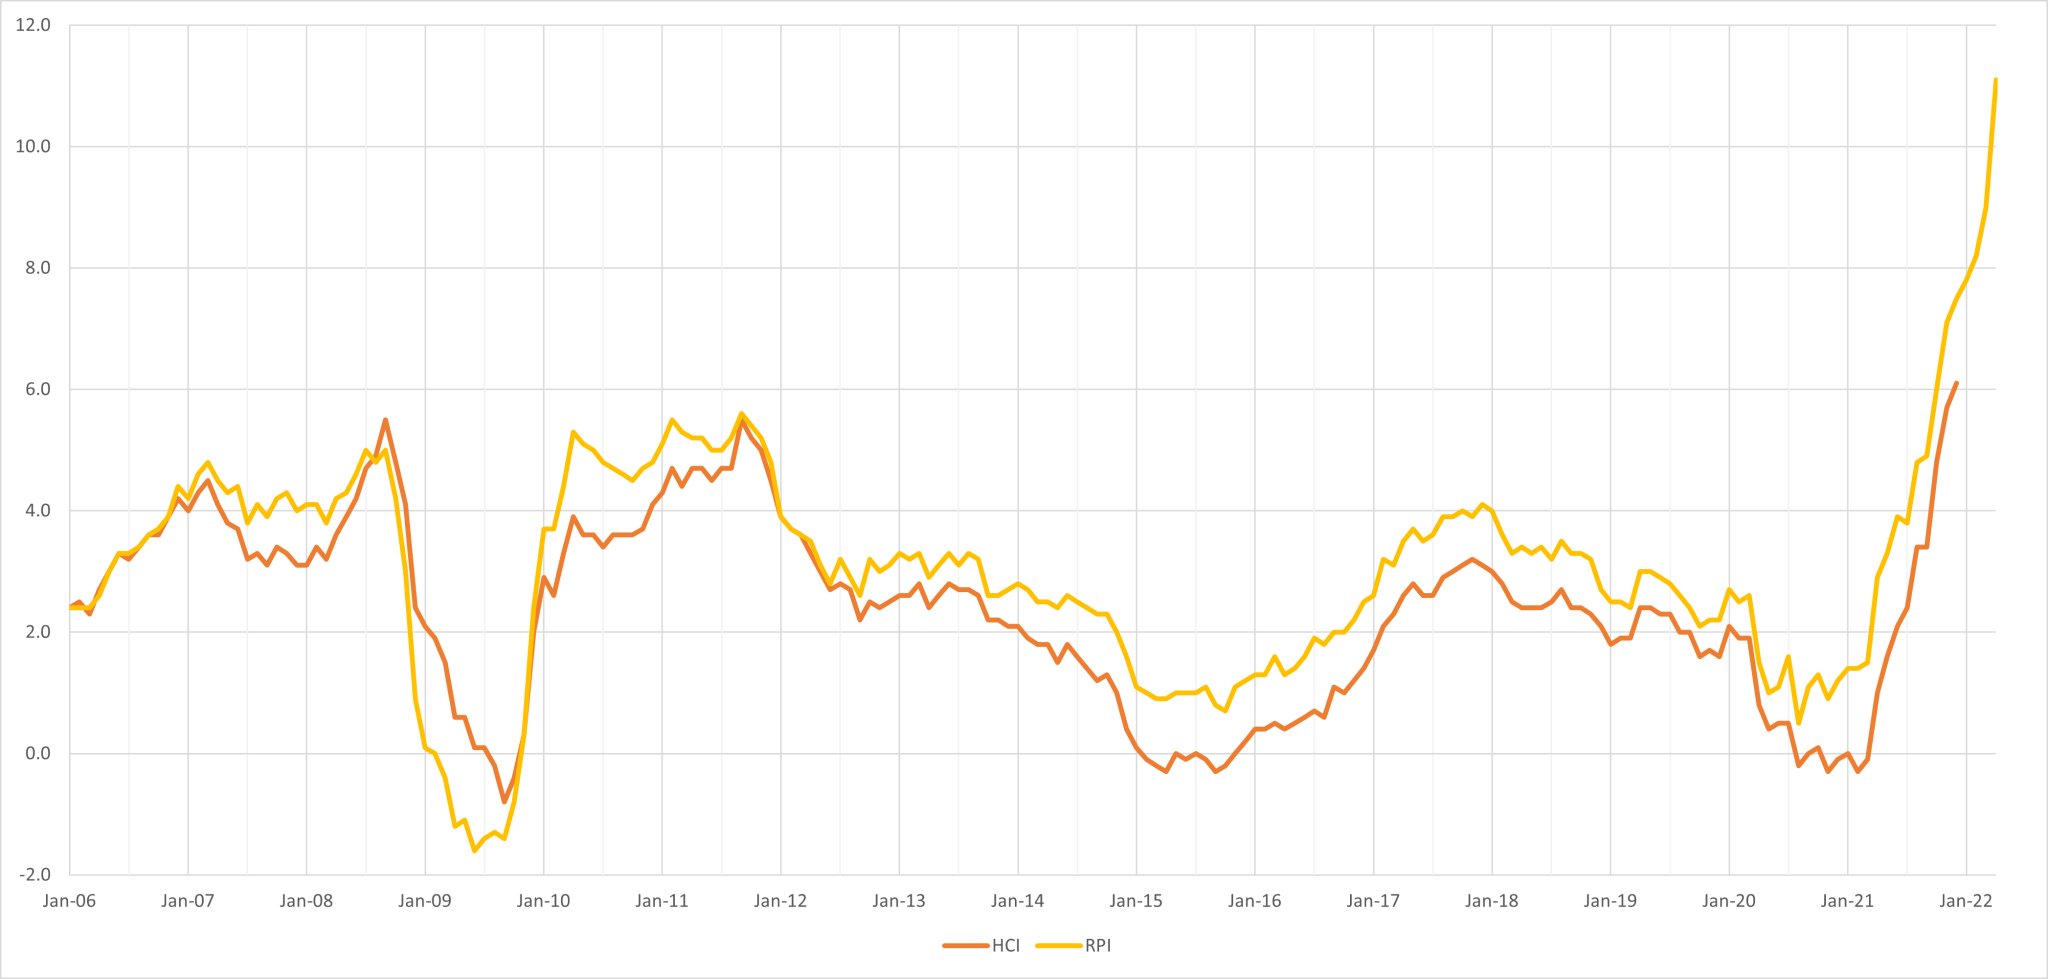

There is, however, a measure of inflation which comes closer to HCI than either CPIH or RPI. This measure can easily be constructed by taking RPI and stripping out the "formula effect"👇 which largely explains why RPI runs higher than CPIH. 15/
www.ons.gov.uk/economy/inflationandpriceindices/timeseries/cptj/mm23
www.ons.gov.uk/economy/inflationandpriceindices/timeseries/cptj/mm23
Let's call this measure RPI-F ("RPI minus the formula effect"). The average rate of RPI-F over 2006-21 is very close to, and slightly below, HCI: 2.28% v. 2.35%. 16/
Moreover, both during the most recent 6 months of 2021 of high inflation, & more generally throughout 2006-21, RPI-H appears to track HCI more closely than does either CPIH or RPI.👇 17/ 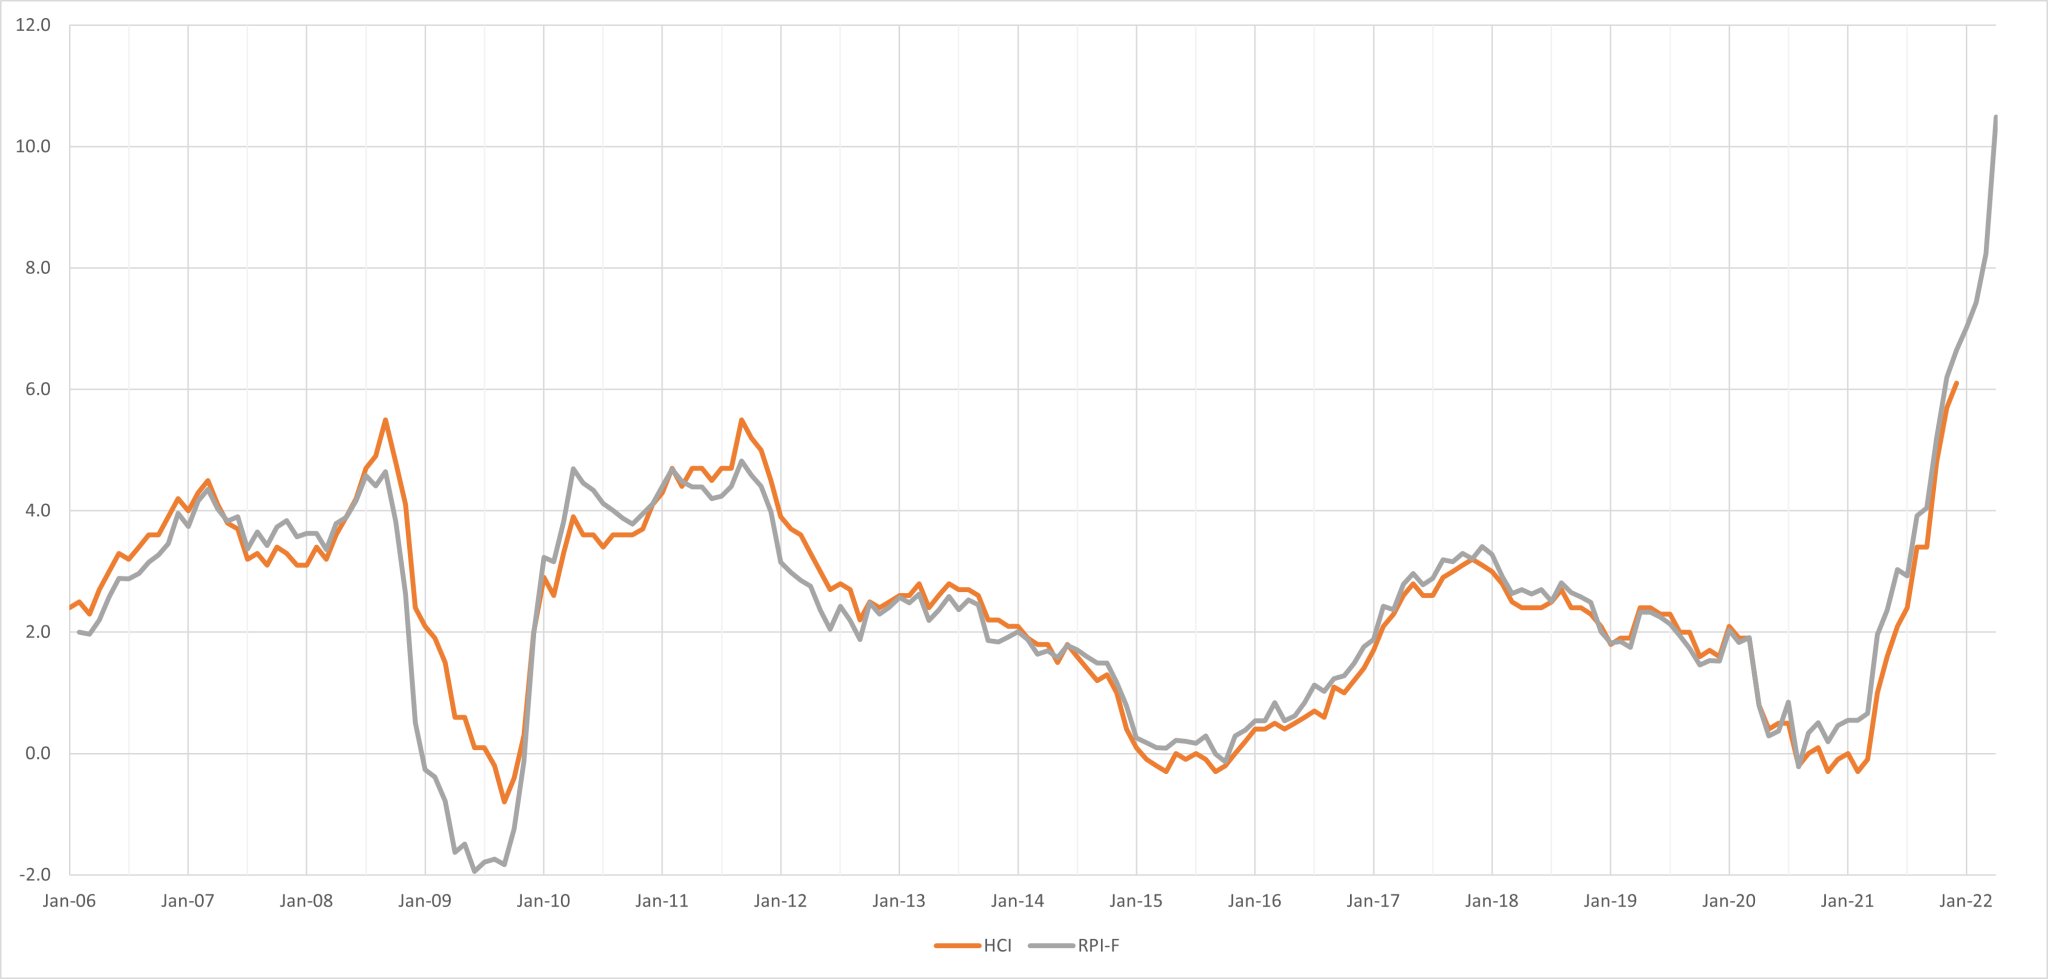

RPI was designed to track the effect of inflation on a typical household, via such things as inclusion of mortgage interest rates & exclusion of the top 4% of high earners. 18/
RPI has, however, attracted criticism for its inclusion of an arithmetic Carli formula which is regarded as overstating inflation by many. The "-F" strips out the Carli formula & replicates the formulas which CPIH uses. 19/
Hence, not only does RPI-F provide the best available match of the HCI index under development. The "-F" eliminates its most controversial aspect. 20/
In sum, there is a very strong case for @UCU & @UCEA1 to agree (pending full monthly-updated rollout of HCI) to RPI-F as the measure which best captures the negative impact of inflation on a typical university worker & negotiate in light of this agreed standard. 21/21
PS: More from the ONS on why they don't include mortgage interest payments in CPIH👇. (From this episode of @Moneybox starting at 6 min 20 sec👇.)
www.bbc.co.uk/sounds/play/m00180hx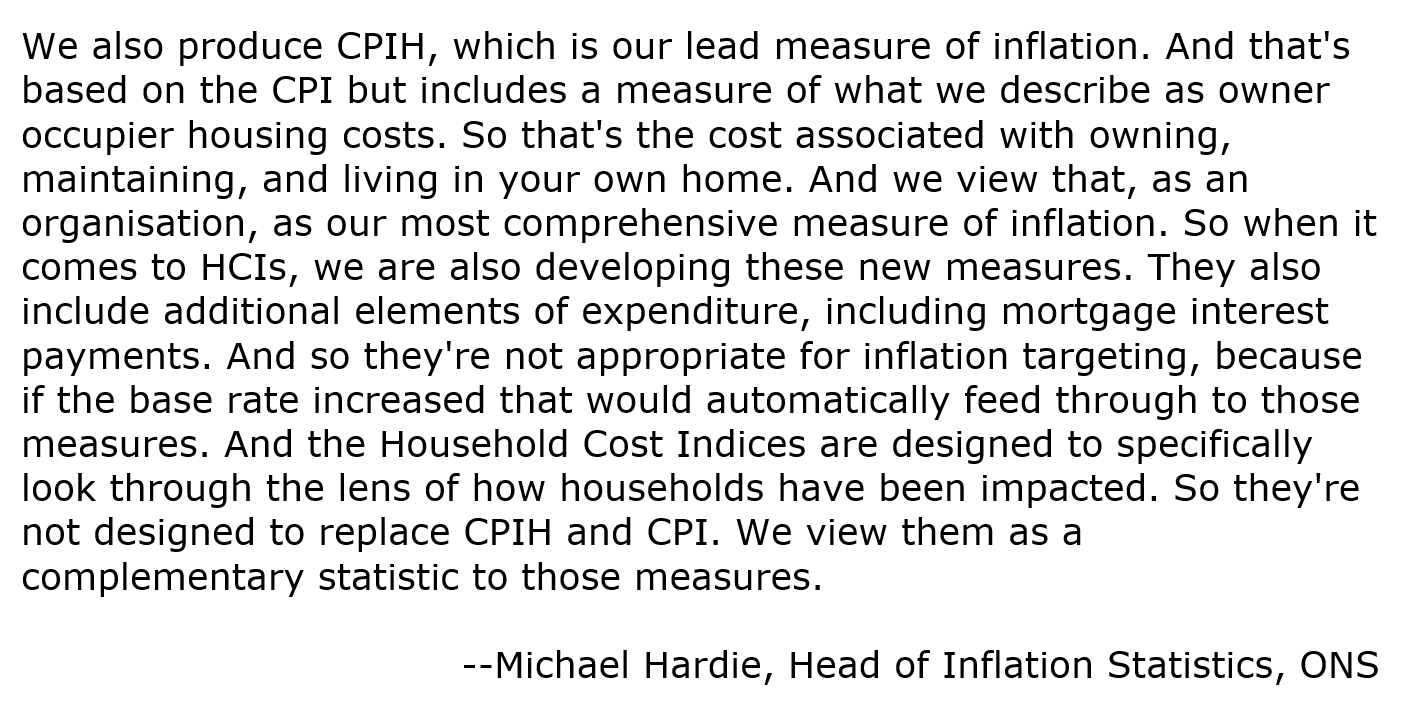
www.bbc.co.uk/sounds/play/m00180hx

Link to @ONS estimate of annual increases in HCI inflation, updated to December 2021👇.
www.ons.gov.uk/economy/inflationandpriceindices/bulletins/householdcostsindices/householdcostsindices...
www.ons.gov.uk/economy/inflationandpriceindices/bulletins/householdcostsindices/householdcostsindices...
@ONS Link to my spreadsheet of data downloaded from the ONS website, which I used to create the above graphs & compute the average rates of inflation👇.
1drv.ms/x/s!ApZ5GcX-ozURge0JVz3ZWM05Hdkg1Q?e=sdKX2U
1drv.ms/x/s!ApZ5GcX-ozURge0JVz3ZWM05Hdkg1Q?e=sdKX2U