Thread by John Street Capital
- Tweet
- Feb 23, 2022
- #Investment
Thread
0/ If '21 was a year of vol beneath the index level '22 has started off as a year of vol everywhere.
The S&P is down (11.3%) YTD, the NASDAQ (16.7%), $BTC (18.9%), the BVP EM Cloud Index (27.4%), ARKK (35.6%), KRE +1.5%, & Energy +21.9%, long value vs. short growth +27.1%
The S&P is down (11.3%) YTD, the NASDAQ (16.7%), $BTC (18.9%), the BVP EM Cloud Index (27.4%), ARKK (35.6%), KRE +1.5%, & Energy +21.9%, long value vs. short growth +27.1%
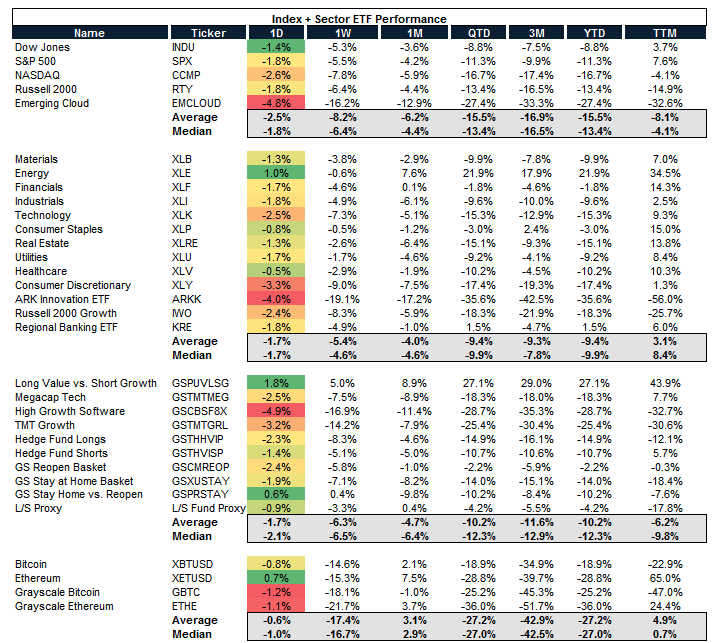
1/ There's a confluence of macro headwinds including an about face of monetary policy, an abatement of fiscal stimulus & heightened geopolitical risks, post elevated multiples after 2 years of free $$
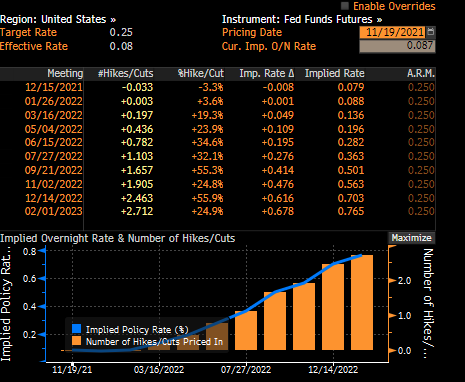
There are 6+ hikes implied today vs. 2 when risk-assets peaked in mid-November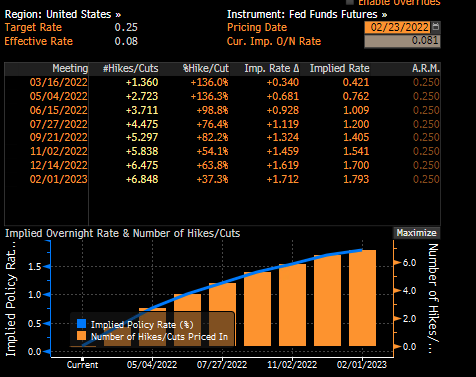
There are 6+ hikes implied today vs. 2 when risk-assets peaked in mid-November


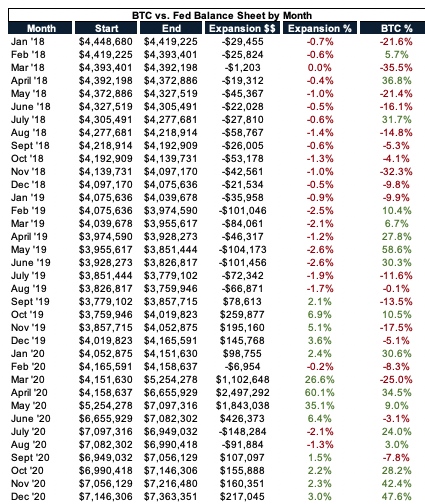
2/ To be clear the Fed is still printing $$ with the Fed B/S expanding by $153B YTD, including $33B the last week of data we had.
This despite the fact that inflation is at the highest levels since 1982 & they have been talking about raising rates for several months now.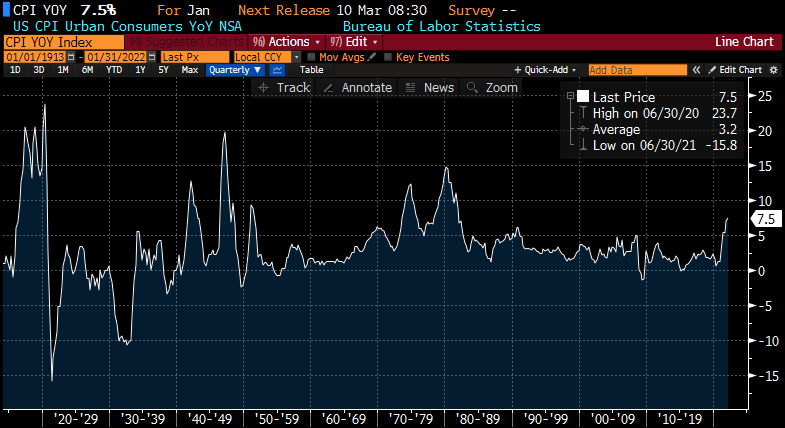
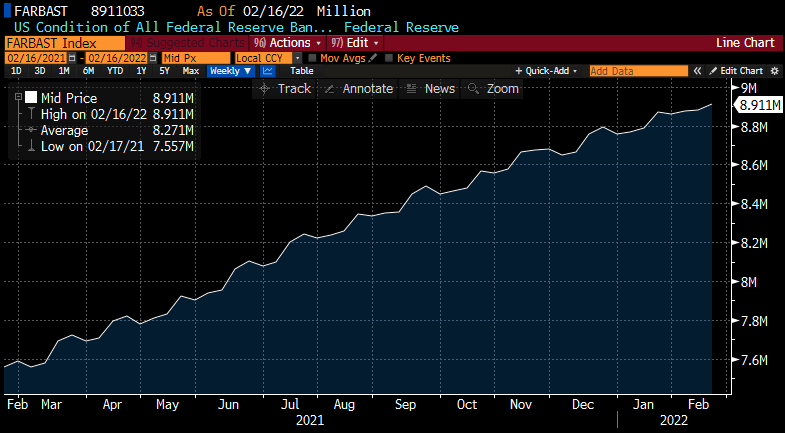
This despite the fact that inflation is at the highest levels since 1982 & they have been talking about raising rates for several months now.


3/ While there's still $525B of fiscal expansion in '22 due to bills that have already passed, the direct transfer payments in the US are largely gone, the personal savings rate is back to pre-COVID levels & spending data from $V $MA $BAC $JPM all growing. 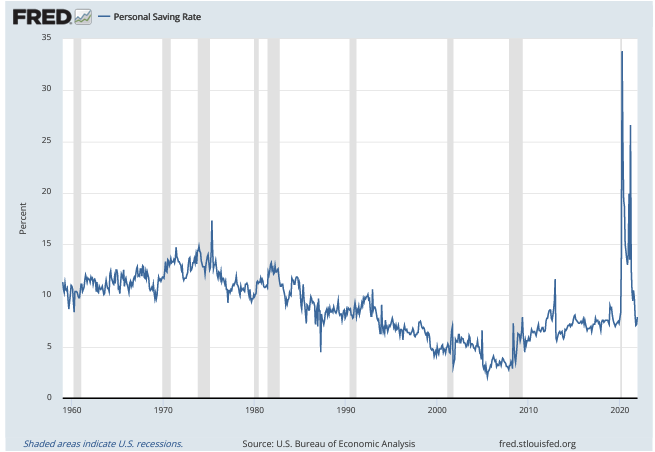

4/ The market is really good at creating supply in the face of demand shocks.
Housing units under construction are back to levels not seen since mid-2006.
The 30-yr mortgage rates are 3.92% vs. 2.75% last summer & 6.5% in mid 2006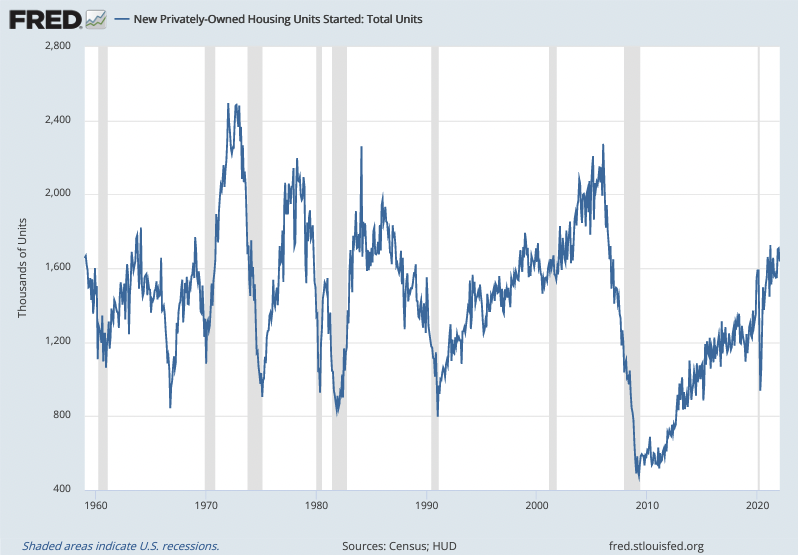
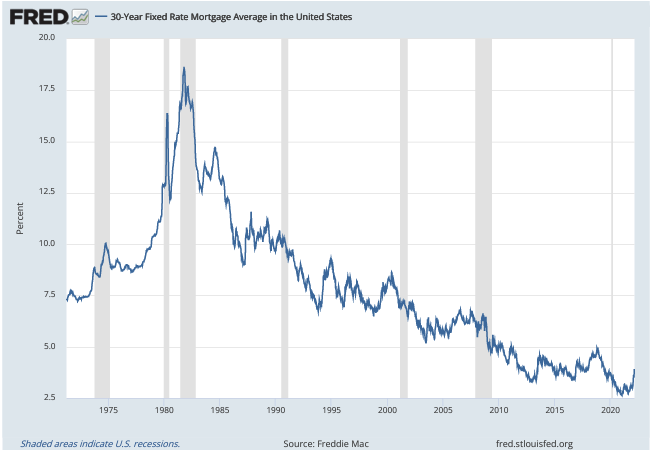
Housing units under construction are back to levels not seen since mid-2006.
The 30-yr mortgage rates are 3.92% vs. 2.75% last summer & 6.5% in mid 2006


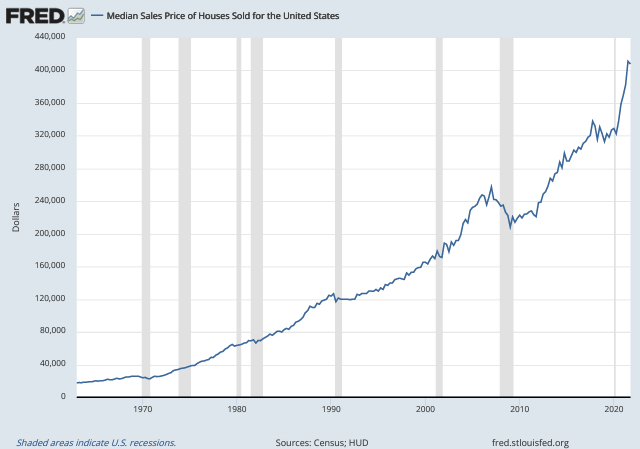
5/ The median sale price of a house in the US is $408K compared to $245K in mid-'06.
We ultimately saw a 20% drawdown peak to trough which would be a retracement back to $325K or levels seen pre-pandemic
How many homes can afford 6 hikes? How does that force the Fed's hand?
We ultimately saw a 20% drawdown peak to trough which would be a retracement back to $325K or levels seen pre-pandemic
How many homes can afford 6 hikes? How does that force the Fed's hand?
6/ The US was facing a housing shortage after years of underbuilding; Freddie Mac estimated 3.8M units, MS has a range of 1.5-5.5M units, if you look at he average starts from 1960-2010 it was ~1.5M starts given the deficit post GFC something in the 2-2.5M range is probably right
7/ Rate hikes + increase supply should put a lid on housing. That coupled with the move in risk assets, increase in energy prices / inflation puts a damper on the wealth effect.
Re: inflation 2/3 of core CPI has seen 4% annualized inflation since last July (vs. 19% in '19) &
Re: inflation 2/3 of core CPI has seen 4% annualized inflation since last July (vs. 19% in '19) &
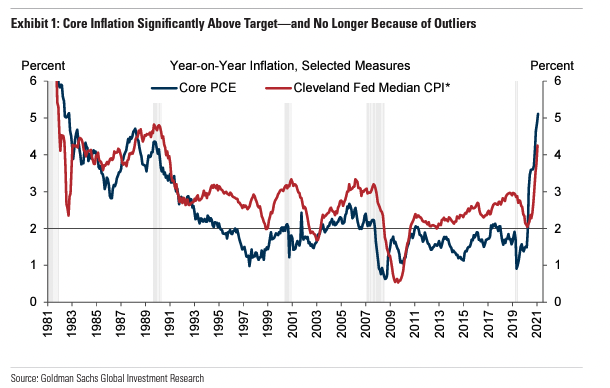
8/ 16% of prices have risen at a double-digit pace (vs. 2% in '19).
The high inflation breadth of the last 6 months argues for continued strength on a headline basis into the spring (not accounting for wage pass through).
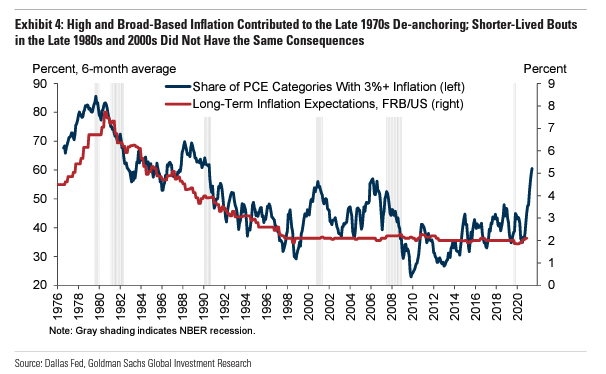
High & rising inflation breadth in the late 70s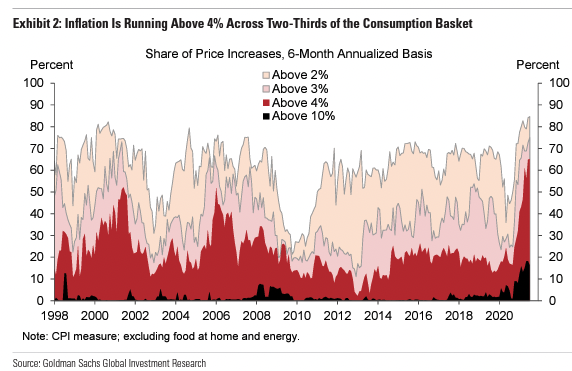
The high inflation breadth of the last 6 months argues for continued strength on a headline basis into the spring (not accounting for wage pass through).
High & rising inflation breadth in the late 70s

9/ coincided with de-anchoring of inflation expectations but in 2000 / 2006 it was shorter lived & did not product a sustained rise in inflation or LT expectations (the Fed tightened in the latter scenarios resulting in an unwind of tech & housing bubbles) 
10/ Fast forward to today with the "quant-ifcation" of equity markets things are priced in much quicker now than they were even 16 years ago let alone 22, or 40+.
The # of NASDAW stocks hitting 52W lows has already passed the dot com bubble & GFC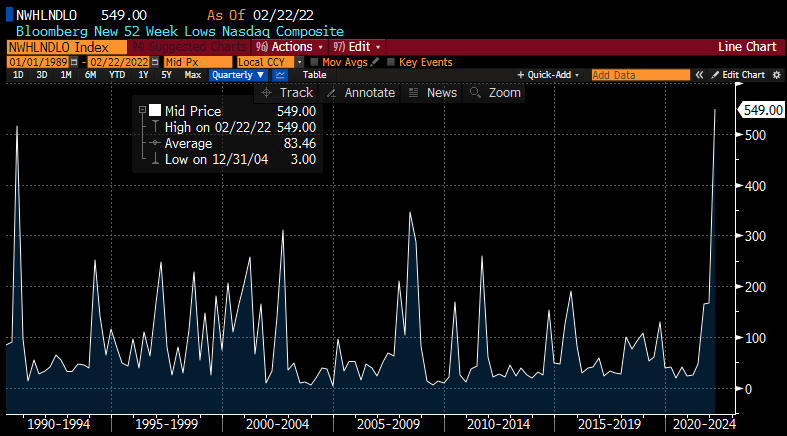
The # of NASDAW stocks hitting 52W lows has already passed the dot com bubble & GFC

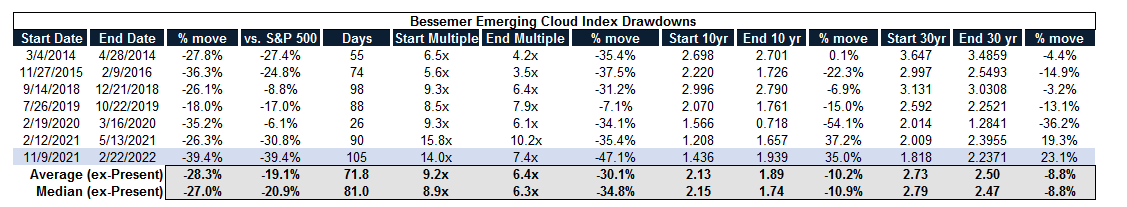
11/ The Bessemer EM Cloud Index has drawn down nearly 40% the biggest drawn down over the past decade.
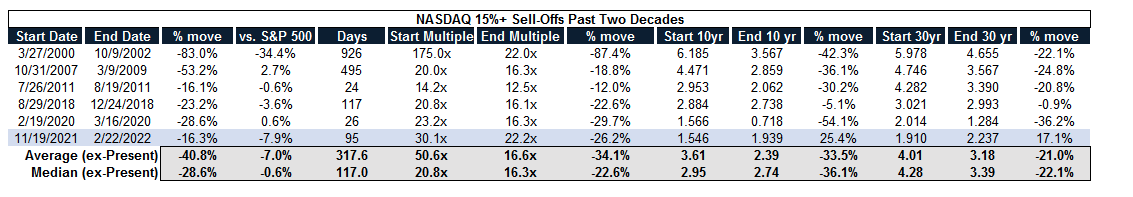
The NASDAQ is down (16.3%) which is still well above the COVID-19 move, tech bubble, and GFC retracements

The NASDAQ is down (16.3%) which is still well above the COVID-19 move, tech bubble, and GFC retracements
12/ A group of 33 FinTech names are down an avg/median of (70%) from their 52W highs, many of which were new issues in the past 24 months.
This compares to SaaS names down (52%) from their 52W highs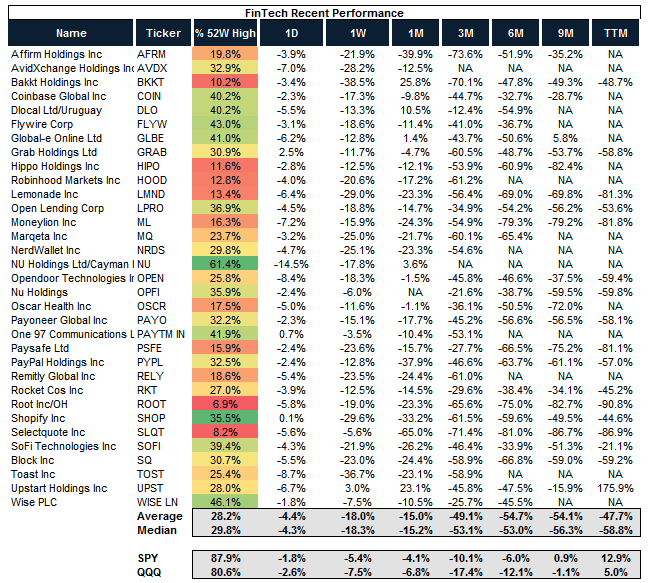
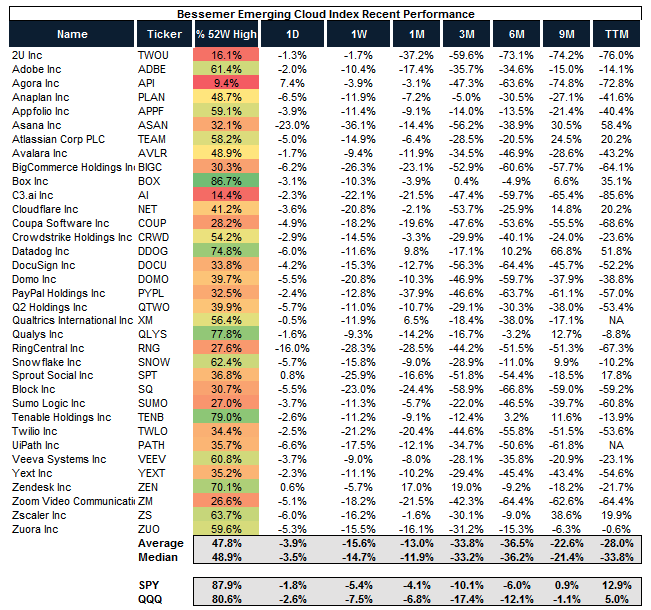
This compares to SaaS names down (52%) from their 52W highs


13/ What about crypto? This compares to the total crypto market cap down (23%) YTD (in pat supported by increased stable coin supply) with a basket of top names down (32%) YTD and (55%) from their 52W highs 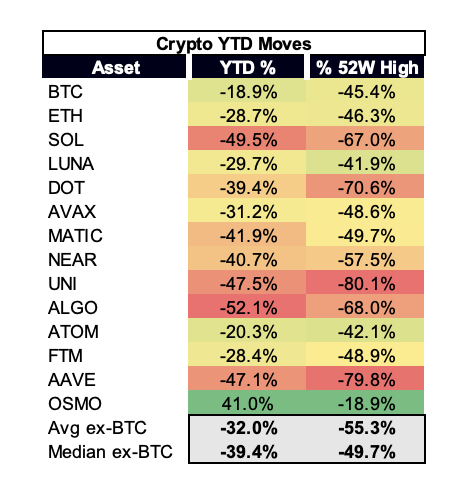

14/ The VIX is back >30+. One of the things that was tested in March '20 (and part of the reason why VIX went to 80, an ATH) was the explosion of vol of vol products post GFC.
You have been paid to systematically sell vol in a QE infinity world resulting in the creation of a #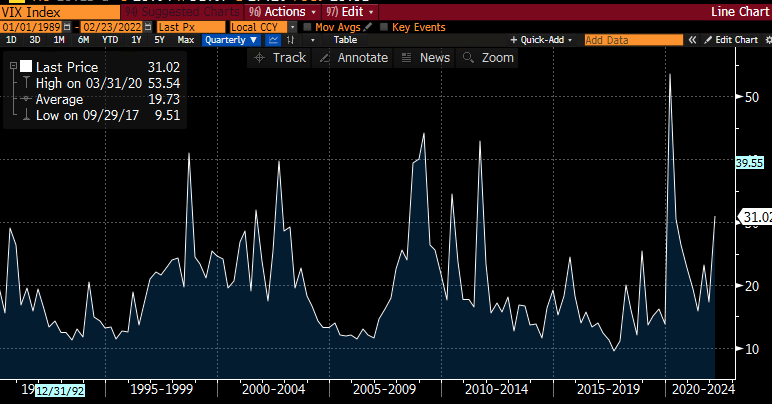
You have been paid to systematically sell vol in a QE infinity world resulting in the creation of a #

15/ products that cause unintended consequences in a risk-off move, resulting in things happening sooner / faster.
So in the fact of this market backdrop that's occurred with the Fed still printing come the March meeting they are going to start to tighten
So in the fact of this market backdrop that's occurred with the Fed still printing come the March meeting they are going to start to tighten
16/ During peak Fed B/S run-off in 2018-2019 we saw $100B+/month roll off and Fed officials have guided to a more aggressive approach this time which would mean a net difference of $220B+ / month of liquidity from the system 
17/ The Fed raised rates 25bps in Dec '15, another 25bps in Dec '16, but it wasn't until March of '17 where they did it 3x in a year (March, June, Dec) & then 4 times in '18 (March, June, Sept, Dec).
The plunge control team had to come out in Dec '18 after 9 hikes over 4 years
The plunge control team had to come out in Dec '18 after 9 hikes over 4 years
18/ The Fed has done a "good" job getting the hikes into the curve now suggesting they want to "move faster not more."
So what does that mean for risk assets? In the face of a slowing economy they have to hope these rate hikes don't break anything in an already fragile system
So what does that mean for risk assets? In the face of a slowing economy they have to hope these rate hikes don't break anything in an already fragile system
19/ with a $220B liquidity deficit per month MoM (aka rolling off an entire $BTC every ~3.5 months).
This in the face of difficult comps YoY for GDP growth, consumer headwinds already addressed means it's hard to imagine a world where they come close to getting all 6+ hikes in
This in the face of difficult comps YoY for GDP growth, consumer headwinds already addressed means it's hard to imagine a world where they come close to getting all 6+ hikes in
20/ The mkt moves much faster today than it did a decade ago but we still don't know if anything will "break" (repo market) until liquidity is actually removed; so it's a combination of levels & time for risk assets but the mkt is starting to slowly discern based on fundamentals.