Thread
10 powerful Excel features every user should know: 📊
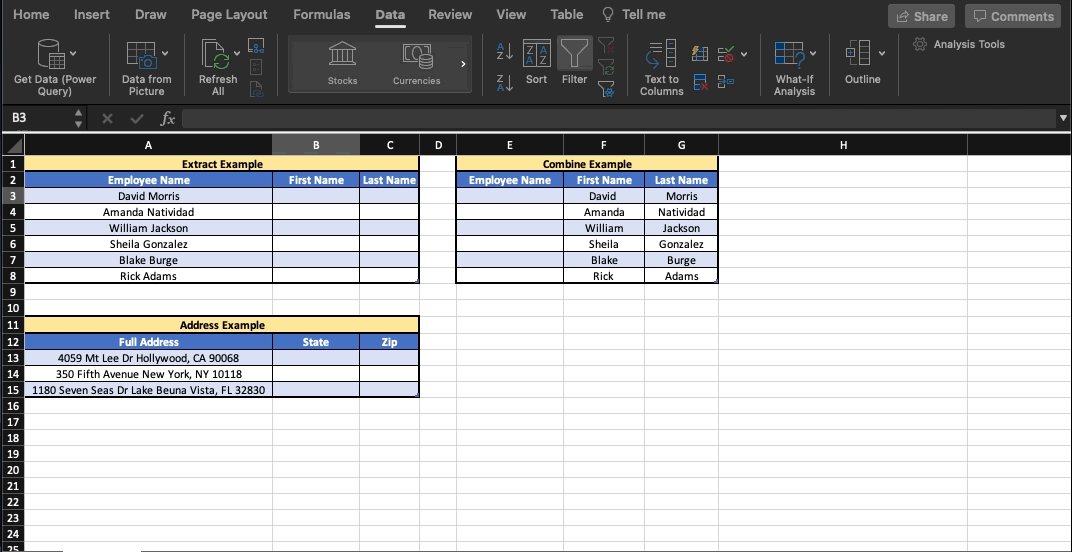
Flash Fill:
Let's say you've got all the data you need––it just isn't in the right place.
"Flash Fill" is your friend.
Quickly extract pieces of text from one cell and move them to another OR combine text from multiple cells into a single place.
Let's say you've got all the data you need––it just isn't in the right place.
"Flash Fill" is your friend.
Quickly extract pieces of text from one cell and move them to another OR combine text from multiple cells into a single place.
Camera Snapshot
Here's a little-known trick to move data between workbooks.
First, add "camera" to your quick access toolbar.
•Select your data ⇢ click 📷
•Paste to new workbook
The cool part: When you update the main workbook, the data in the picture updates as well! 🤯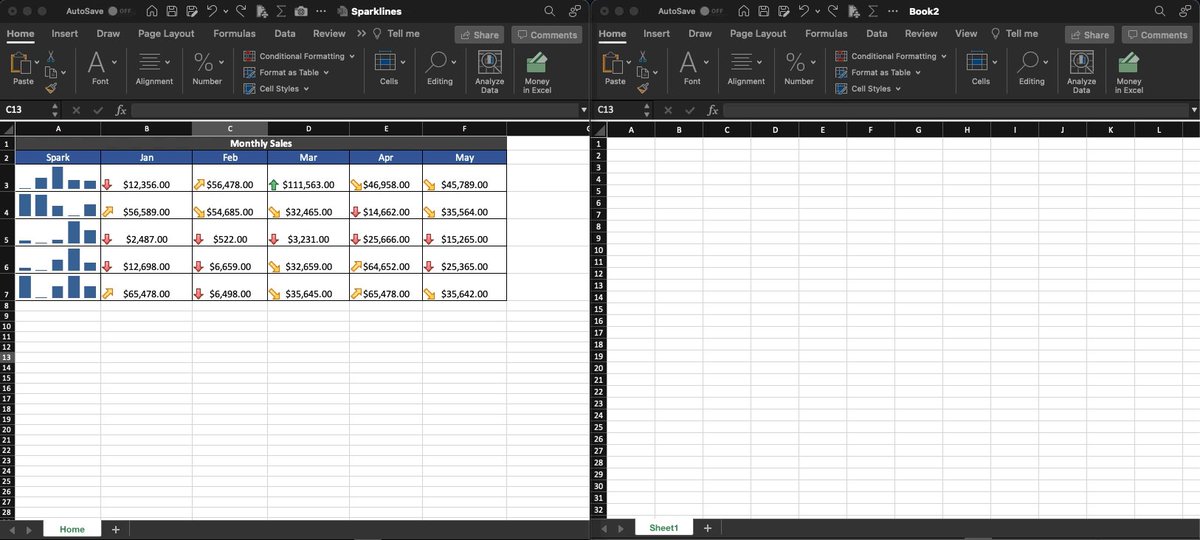
Here's a little-known trick to move data between workbooks.
First, add "camera" to your quick access toolbar.
•Select your data ⇢ click 📷
•Paste to new workbook
The cool part: When you update the main workbook, the data in the picture updates as well! 🤯

Analyze Data:
I was never very good at Pivot tables, graphs, & analyzing data on my own.
Lucky for me (and you) Excel will do the heavy lifting for us.
•Select the range of data
•"Home" ⇢ "Analyze Data"
Charts, tables, & analysis––premade.
Click "insert" & you're done!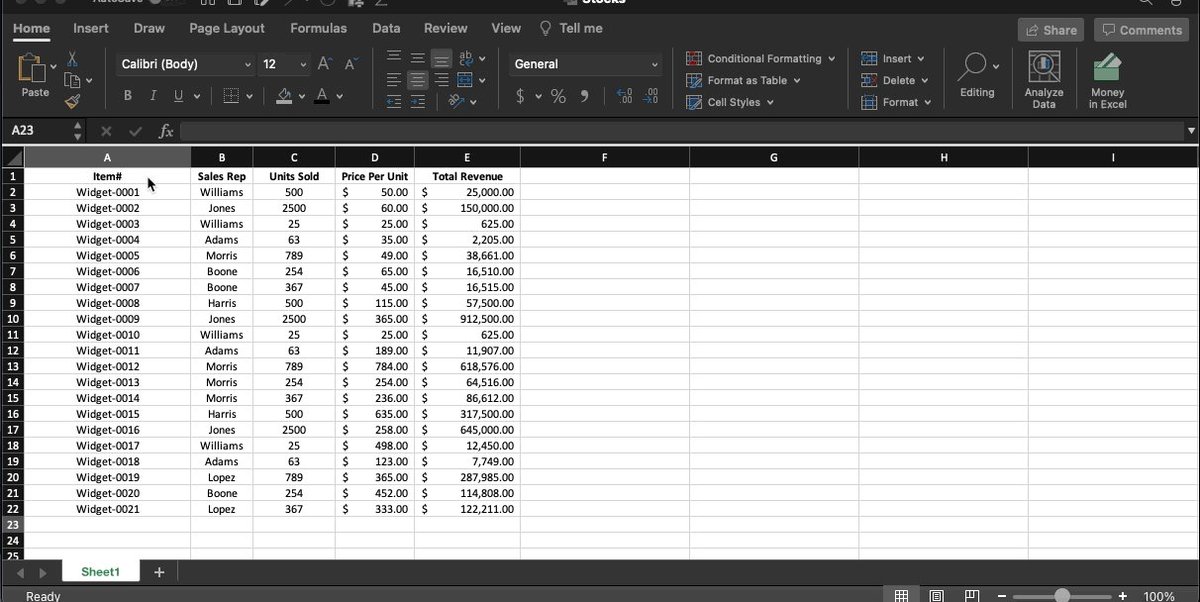
I was never very good at Pivot tables, graphs, & analyzing data on my own.
Lucky for me (and you) Excel will do the heavy lifting for us.
•Select the range of data
•"Home" ⇢ "Analyze Data"
Charts, tables, & analysis––premade.
Click "insert" & you're done!

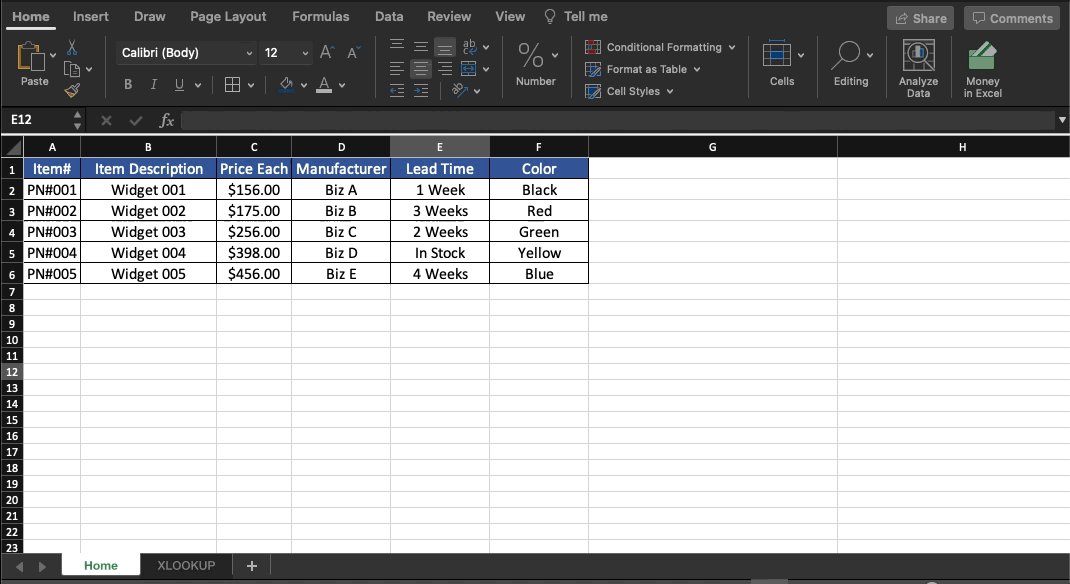
X-Lookup
If you're an old-school Excel user, there's no doubt you're familiar with V-Lookup.
X is the new & improved version, here's why:
•Lookup array does NOT have to be only on the left-hand side.
•Allows you to return multiple values at the same time.
Here's how: 👇🏻
If you're an old-school Excel user, there's no doubt you're familiar with V-Lookup.
X is the new & improved version, here's why:
•Lookup array does NOT have to be only on the left-hand side.
•Allows you to return multiple values at the same time.
Here's how: 👇🏻
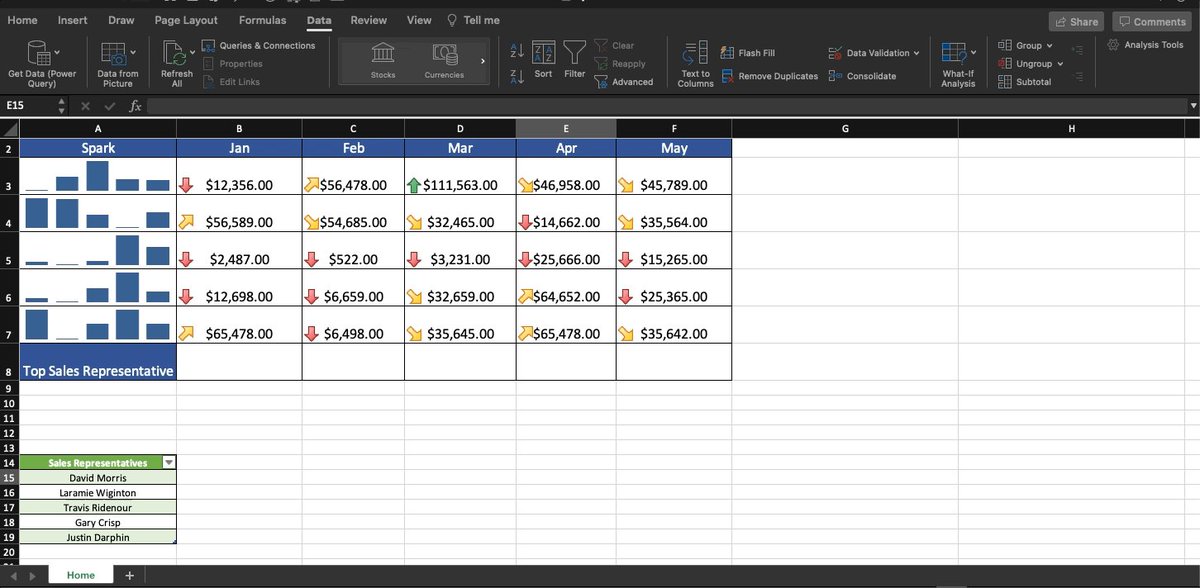
Sparklines:
One of my personal favorites.
Sparklines allow you to insert miniature graphs inside an individual cell to easily visualize data.
•Select range
•Insert ⇢ Sparkline
• Choose type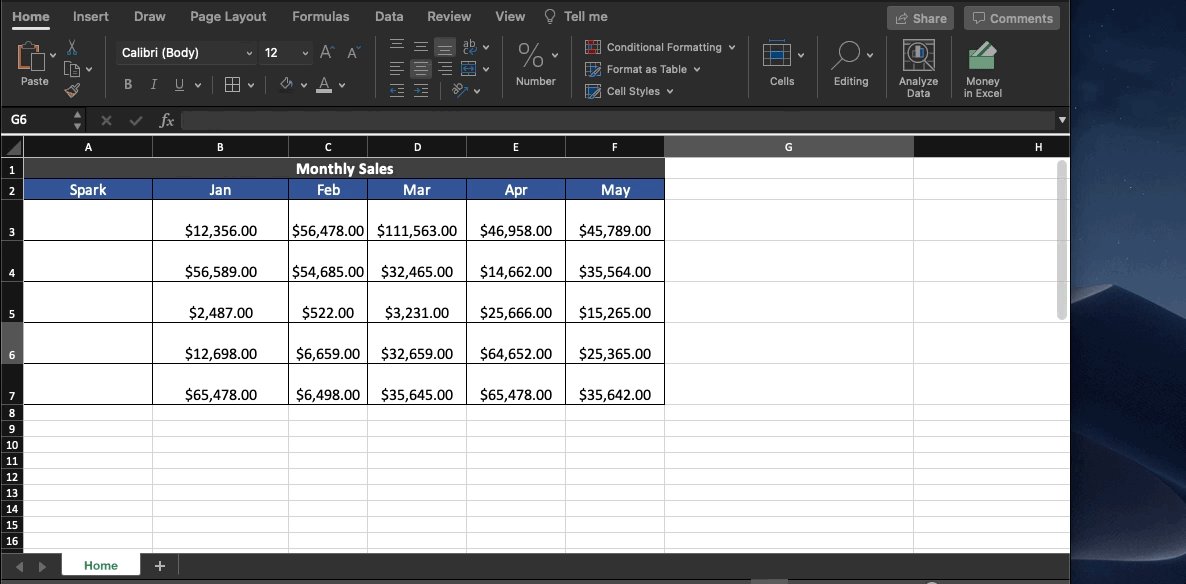
One of my personal favorites.
Sparklines allow you to insert miniature graphs inside an individual cell to easily visualize data.
•Select range
•Insert ⇢ Sparkline
• Choose type

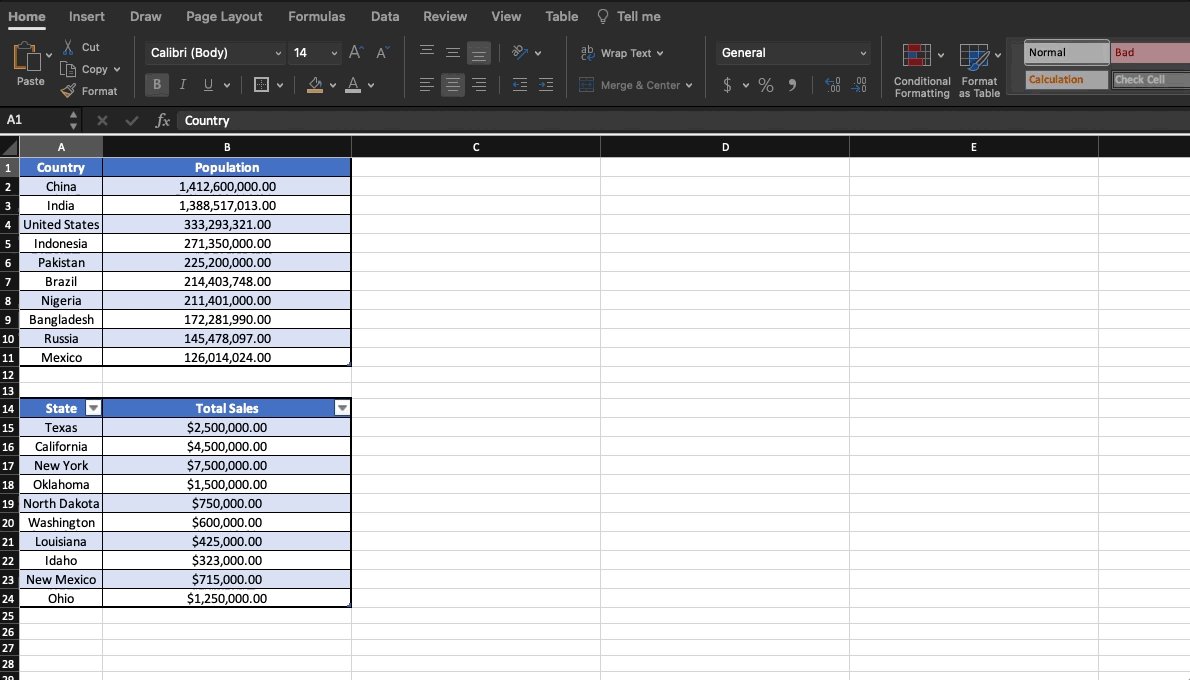
Geography / Maps:
Often, a geographical representation of your data can be quite useful.
Need to see where the majority of your customers live?
Interested in which states are driving the most revenue?
•Select your range of data
•Insert ⇢ Map
It's that easy.
Often, a geographical representation of your data can be quite useful.
Need to see where the majority of your customers live?
Interested in which states are driving the most revenue?
•Select your range of data
•Insert ⇢ Map
It's that easy.
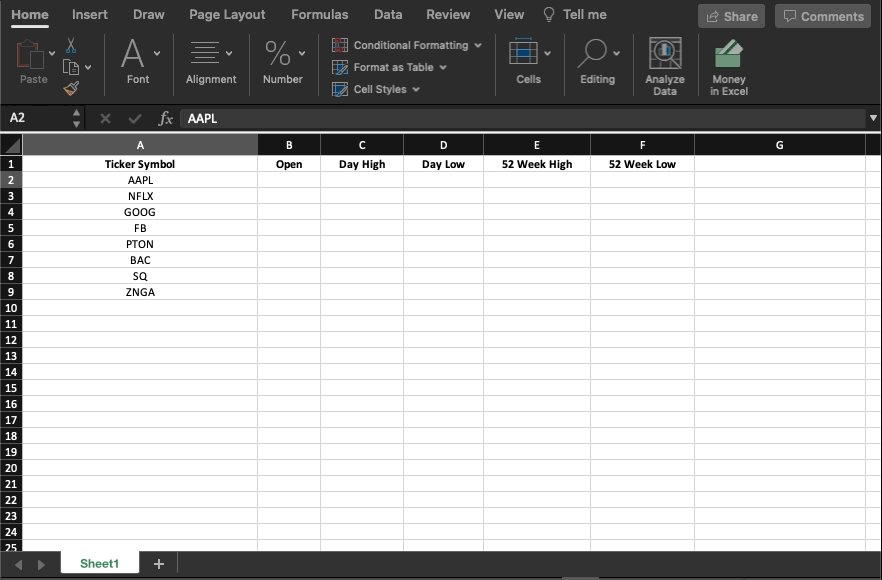
Live stockmarket data:
Easily track 31 different metrics related to companies of your choice.
• Enter ticker symbols
• Select the "Data" tab
• Select "Stocks"
• Choose the metrics you'd like to track.
Easily track 31 different metrics related to companies of your choice.
• Enter ticker symbols
• Select the "Data" tab
• Select "Stocks"
• Choose the metrics you'd like to track.
Conditional Formatting:
As you can tell, I'm a big fan of visualizing data.
Conditional formatting is one of the best (and easiest) ways to do this.
Let's face it, if your data looks good, you look good.
Spice it up by adding data bars, heat maps, or icon sets to show trends: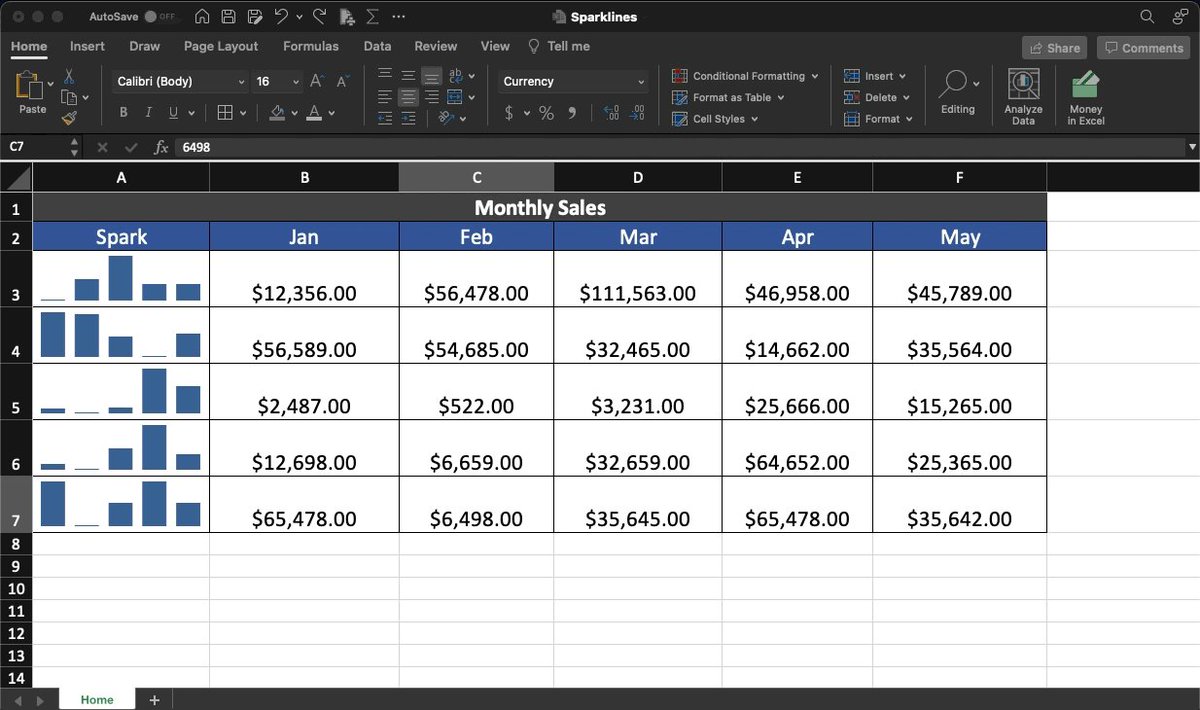
As you can tell, I'm a big fan of visualizing data.
Conditional formatting is one of the best (and easiest) ways to do this.
Let's face it, if your data looks good, you look good.
Spice it up by adding data bars, heat maps, or icon sets to show trends:

Drop Down lists:
If you've spent any time working in spreadsheets at all you know one thing:
They're only as good as the data entered.
My favorite way to ensure consistency & accuracy is Drop Down lists.
It's easy & guarantees the data will be entered correctly––every time.
If you've spent any time working in spreadsheets at all you know one thing:
They're only as good as the data entered.
My favorite way to ensure consistency & accuracy is Drop Down lists.
It's easy & guarantees the data will be entered correctly––every time.
Background Images:
OK, I'll be honest.
I'm not sure how "powerful" this is, but man, it looks cool.
Did you know you can add your own custom background images to your spreadsheets?
You didn't? Me either.
Check it out: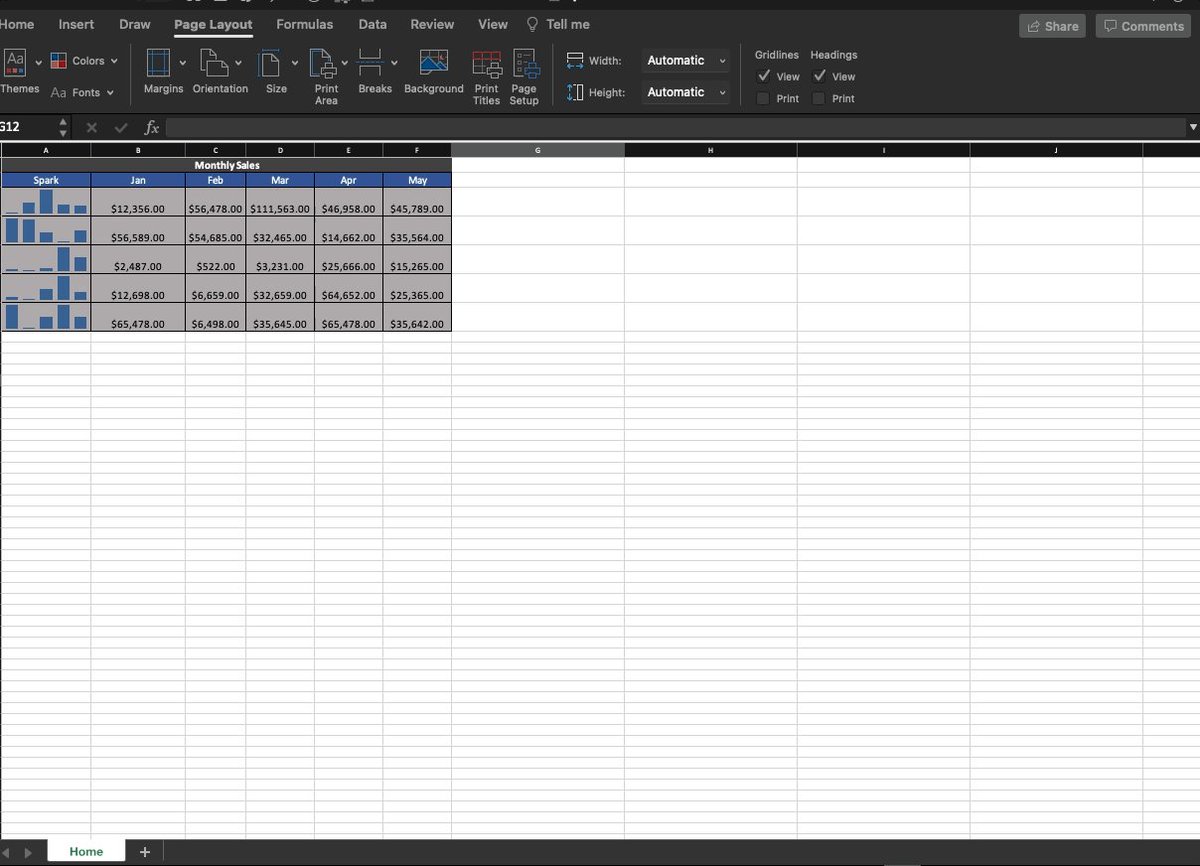
OK, I'll be honest.
I'm not sure how "powerful" this is, but man, it looks cool.
Did you know you can add your own custom background images to your spreadsheets?
You didn't? Me either.
Check it out:

Thanks for reading!
If you learned something new today:
Follow me @blakeaburge for weekly threads on business, productivity, & building a better you.
Check out my newsletter:
"While You Were Away"
•The best of Twitter
•In your inbox
•Every Sunday
whileyouwereaway.beehiiv.com/subscribe
If you learned something new today:
Follow me @blakeaburge for weekly threads on business, productivity, & building a better you.
Check out my newsletter:
"While You Were Away"
•The best of Twitter
•In your inbox
•Every Sunday
whileyouwereaway.beehiiv.com/subscribe
For those asking, here's another on based on Google Sheets I did a while back.
Mentions
See All
Nick Huber @sweatystartup
·
Feb 27, 2022
Amazing thread
Brian Feroldi @BrianFeroldi
·
Feb 26, 2022
These threads are so awesome