Thread
THREAD - Using Long-Term & Short-Term Holder cost basis to navigate the #Bitcoin market cycle.
Using the realized price (essentially the average cost basis) of long-term holders (LTHs) and short-term holders (STHs), we can evaluate what cycle the $BTC market is in.
🧵🧵
Using the realized price (essentially the average cost basis) of long-term holders (LTHs) and short-term holders (STHs), we can evaluate what cycle the $BTC market is in.
🧵🧵

1. Using the market value to realized value (MVRV) in @glassnode for both LTHs & STHs, we can backwards compute the cost basis (technically: realized price) of the two cohorts of investors.
Here is LTH MVRV & STH MVRV over time.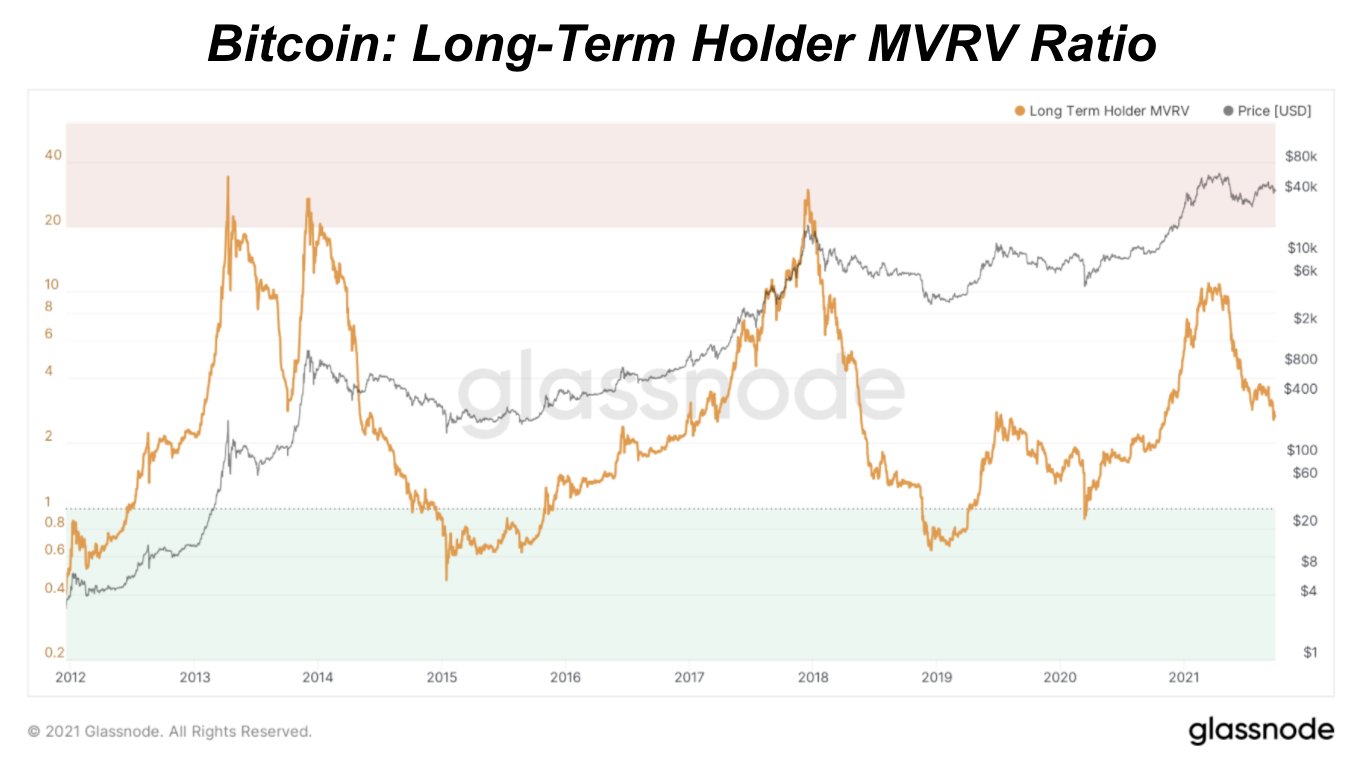
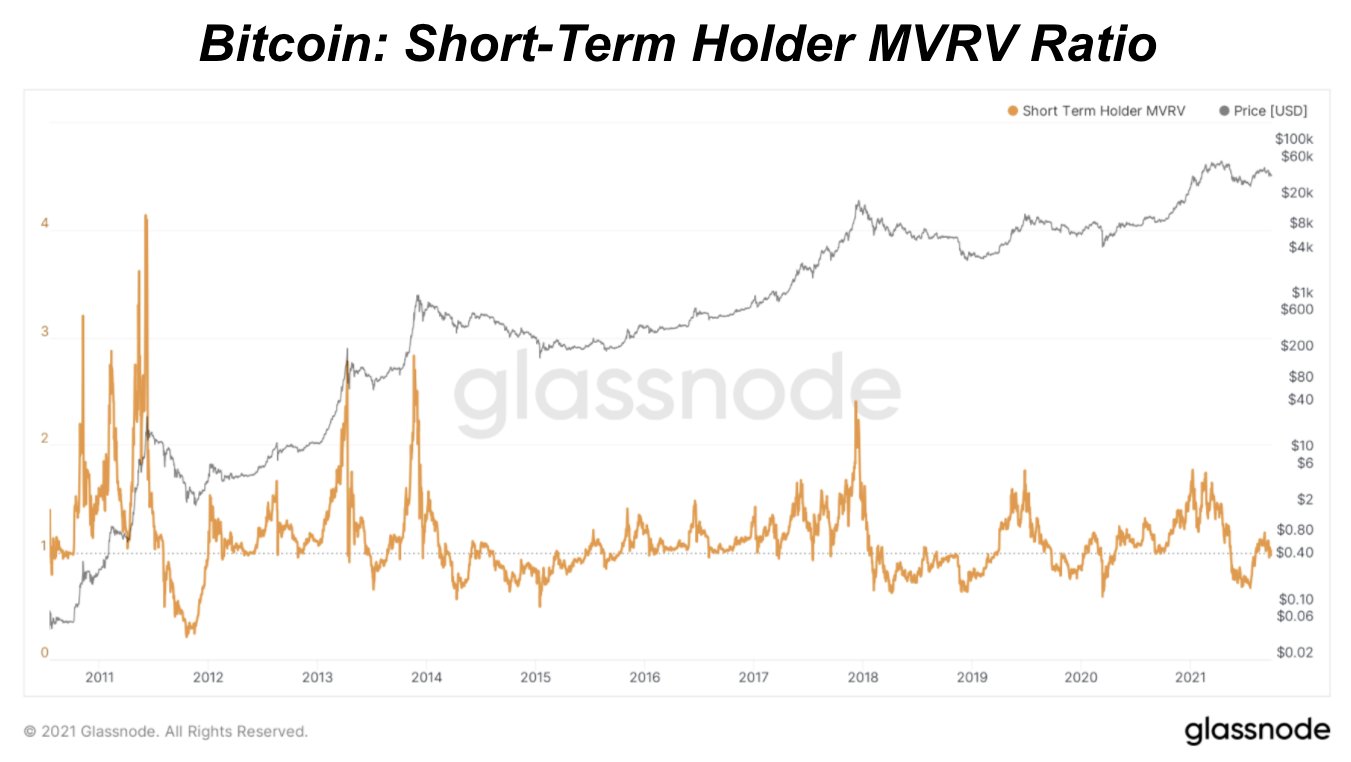
Here is LTH MVRV & STH MVRV over time.


2. How are long-term holders (LTHs) defined? Glassnode defines a LTH as a coin that has not moved in 155+ days.
This is because the longer a coin is dormant the lower probability it is spent into the future.
Check out this article for additional details: insights.glassnode.com/quantifying-bitcoin-hodler-supply/

This is because the longer a coin is dormant the lower probability it is spent into the future.
Check out this article for additional details: insights.glassnode.com/quantifying-bitcoin-hodler-supply/


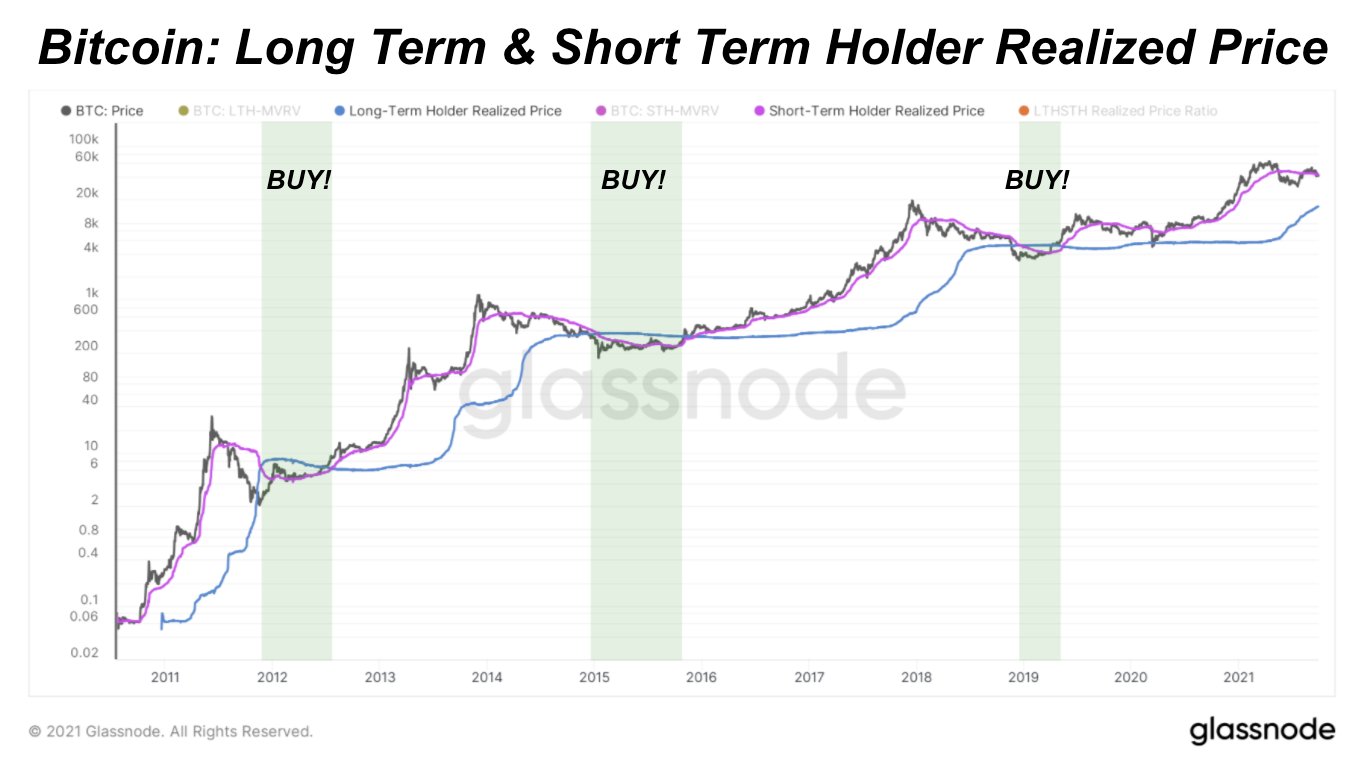
3. So now that we have defined what classifies a LTH, and we can compute the cost basis of both LTH & STH, what can this tell us?
Well if you take a look at the moments when STH realized price fell below LTH realized price you get quite the signal 👀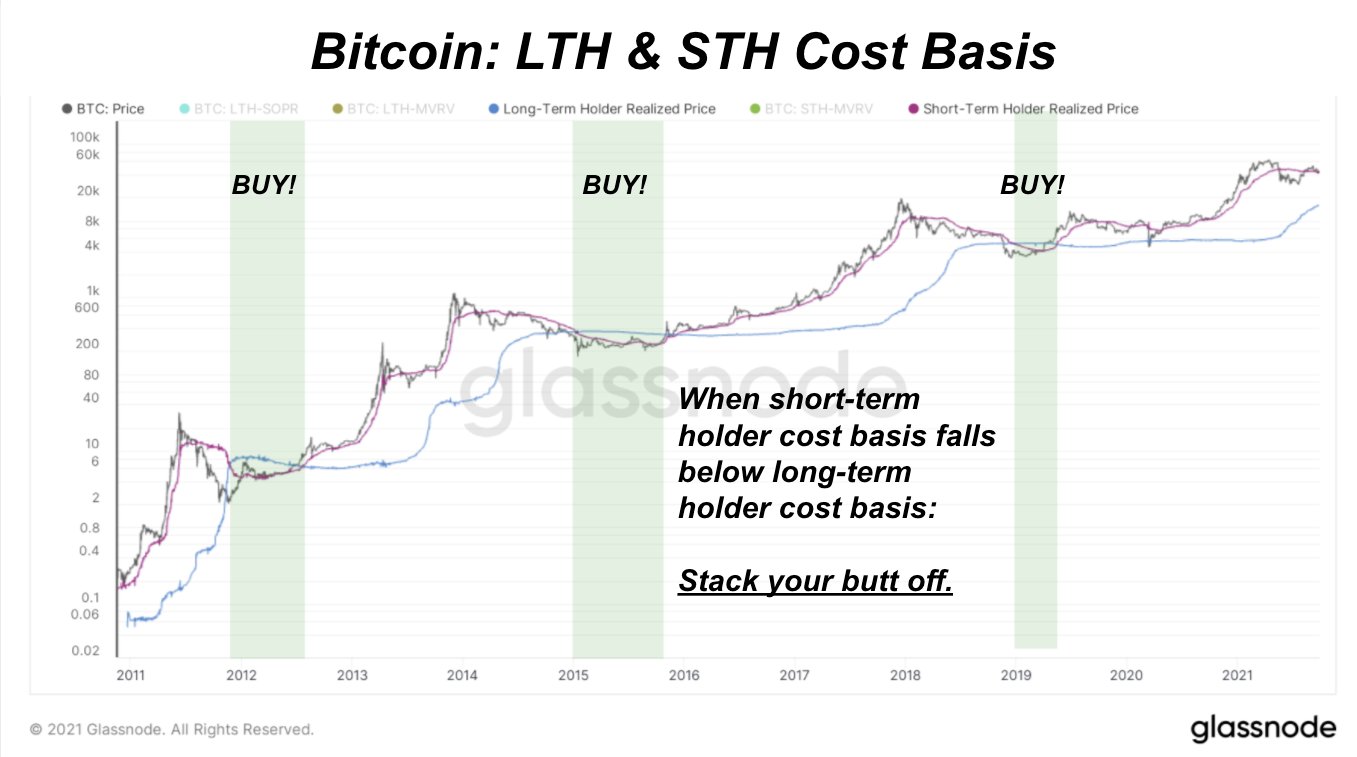
Well if you take a look at the moments when STH realized price fell below LTH realized price you get quite the signal 👀

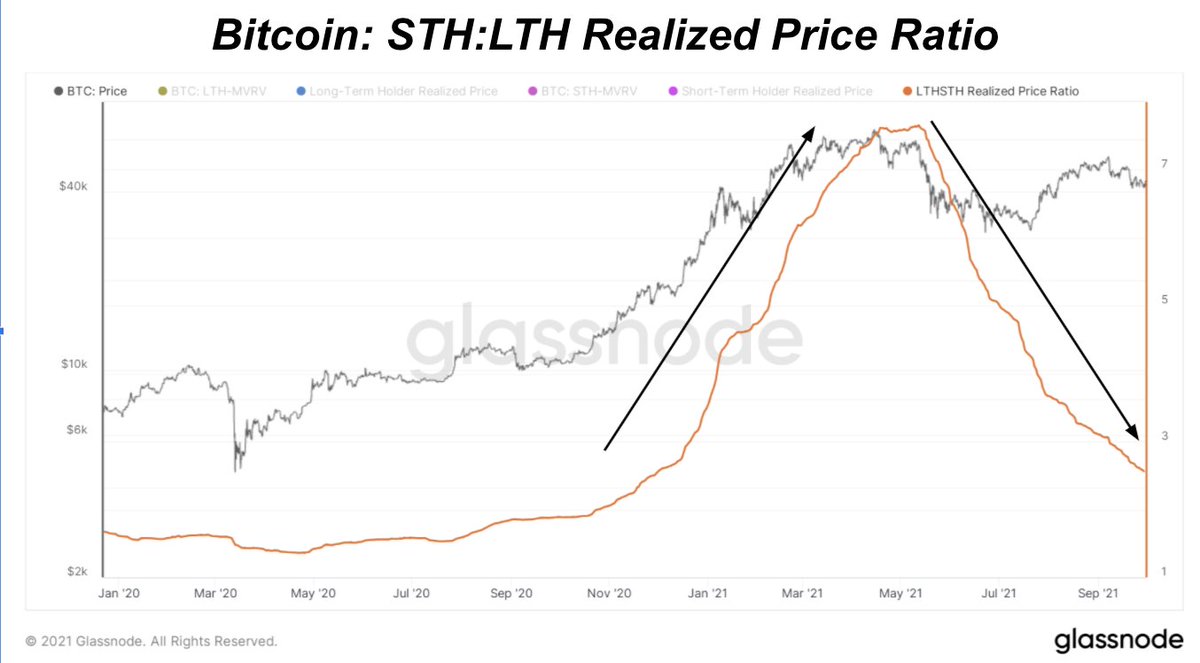
4. But wait... there's more. If you take a ratio of STH:LTH realized price, here's what you get.
This is the same data, visualized in a different way. A dip below the black dotted line means that STHs paid less than average than LTHs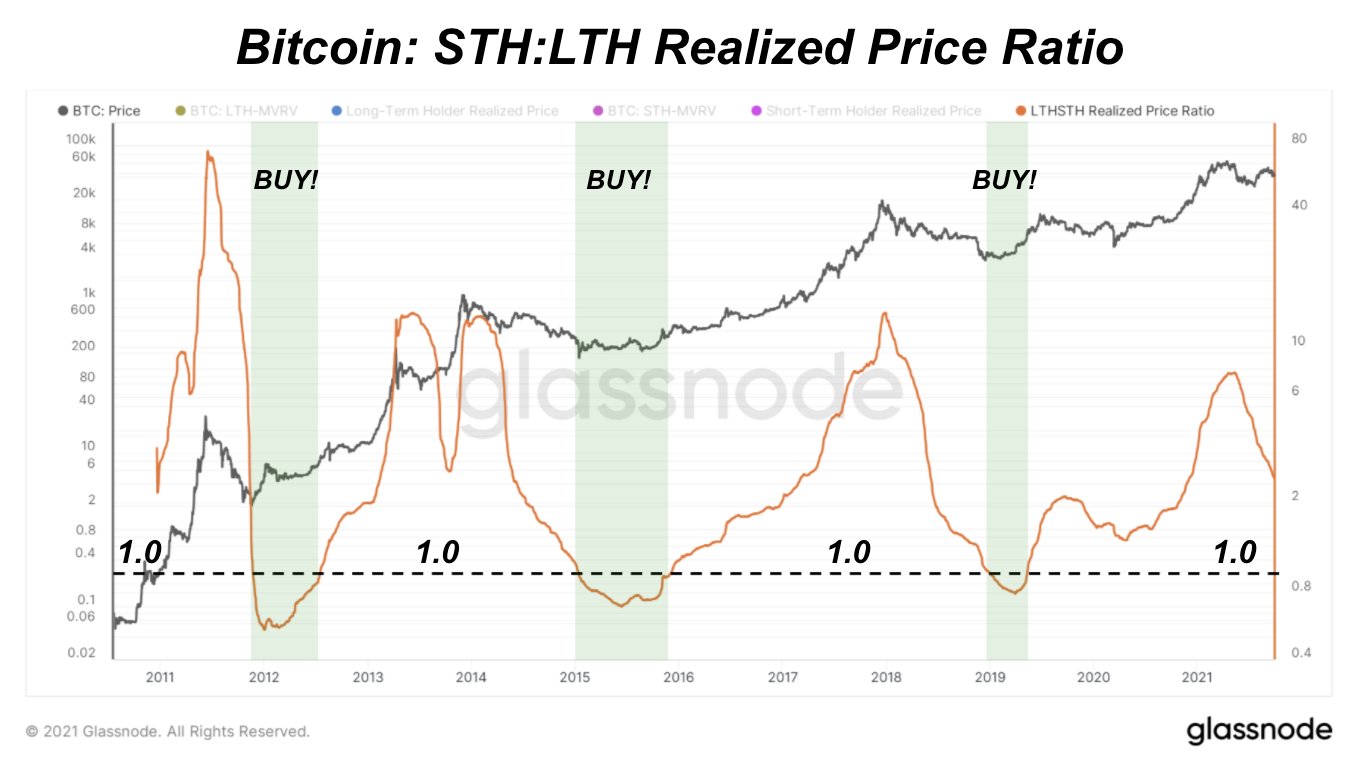
This is the same data, visualized in a different way. A dip below the black dotted line means that STHs paid less than average than LTHs

5. So basically we have a generational bottom indicator, but is there anything else that can be derived from this ratio?
Yup, you bet 👇👇
Yup, you bet 👇👇
6. When the STH:LTH Realized Price Ratio is increasing, this means that STH cost basis is increasing relative to LTH cost basis, and vis versa. 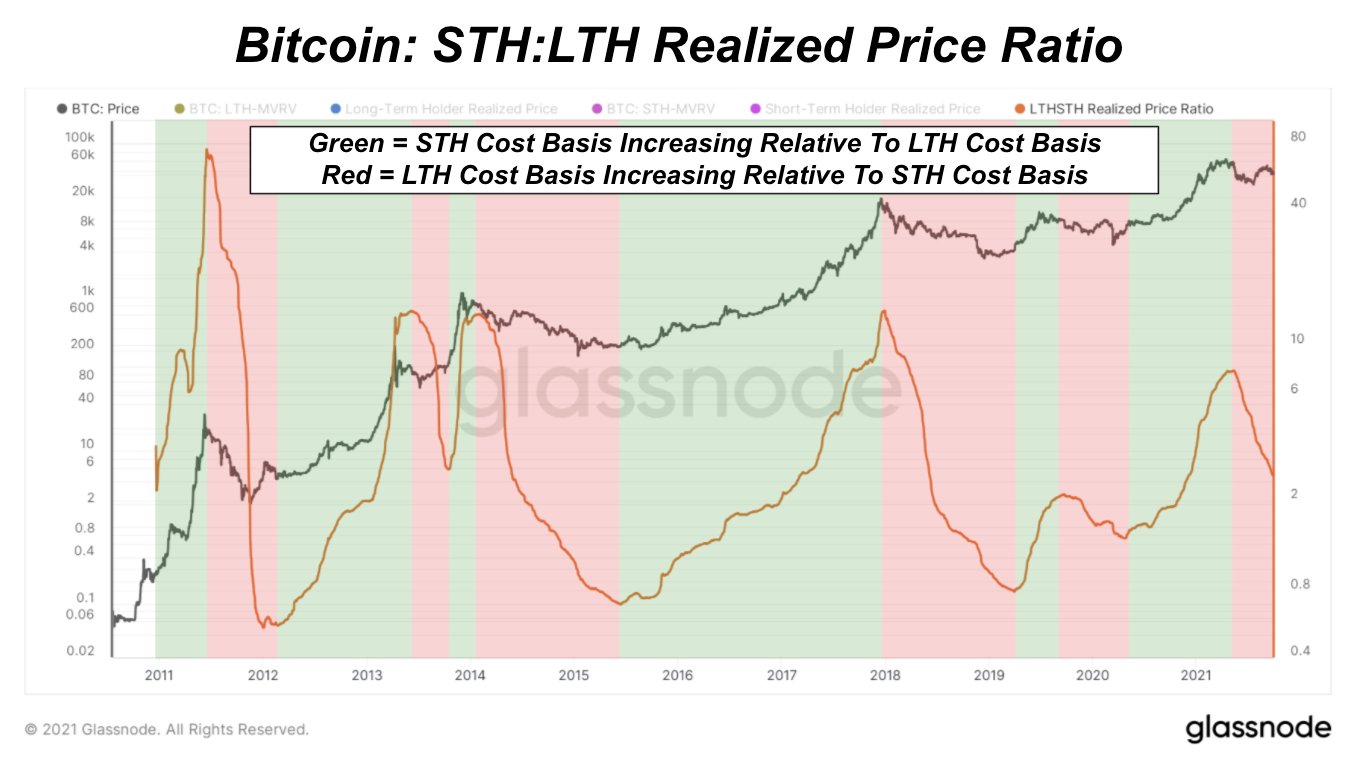

7. $BTC rises when the marginal seller is exhausted.
This is why you see the cost basis of LTHs stay stagnant during explosive bull runs, while the cost basis of STHs (many of whom are new market participants) explode - there are simply not enough coins to go around.
Thus NGU!
This is why you see the cost basis of LTHs stay stagnant during explosive bull runs, while the cost basis of STHs (many of whom are new market participants) explode - there are simply not enough coins to go around.
Thus NGU!
8. So what's happening today?
Following an explosive during late 2020 and early 2021, $BTC is ranging around 40k. But under, the surface, the cost basis of LTHs is rising while STHs is slowly falling.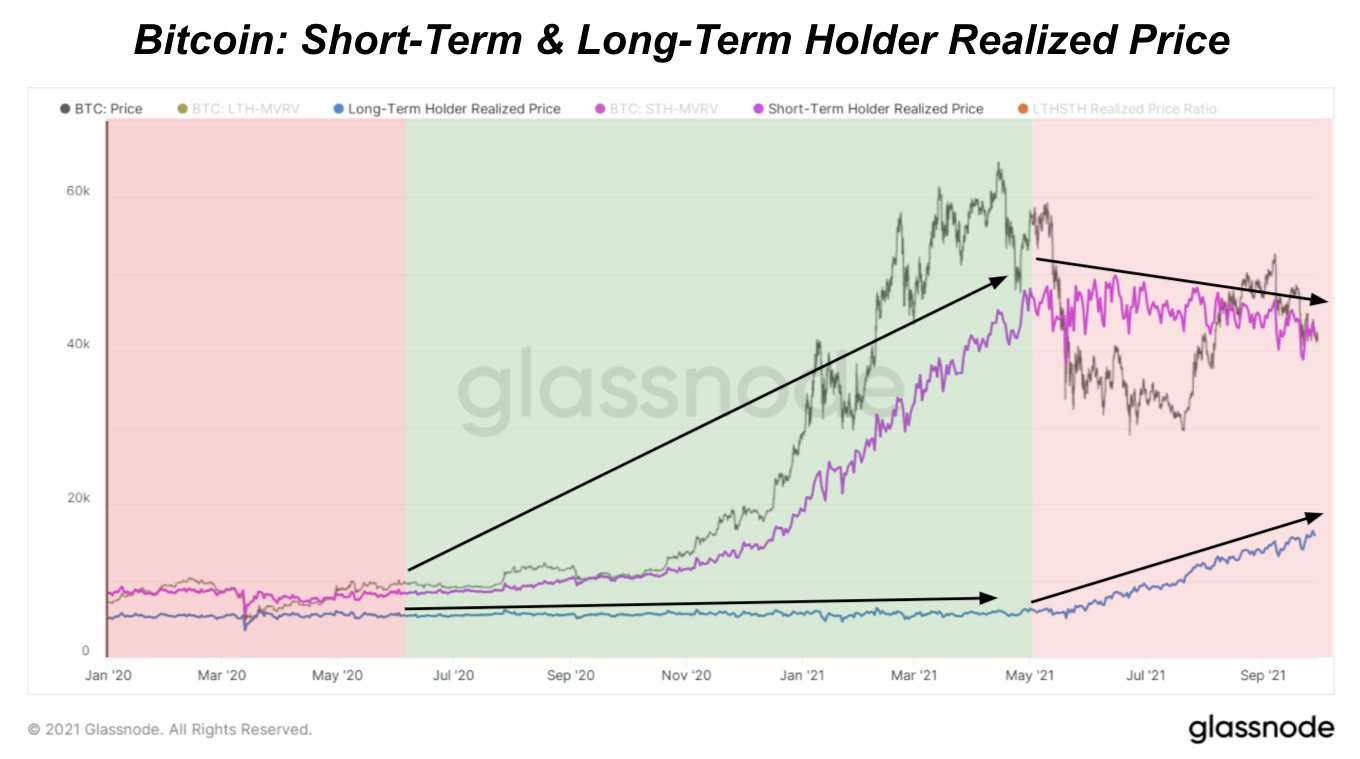
Following an explosive during late 2020 and early 2021, $BTC is ranging around 40k. But under, the surface, the cost basis of LTHs is rising while STHs is slowly falling.

9. Is this a bearish signal? Doubtful in my opinion, and here's why: $BTC runs after the marginal seller is exhausted.
So while the price is ranging, and the "chart looks ugly", smart money is happily accumulating.
Think of a spring slowly being compressed...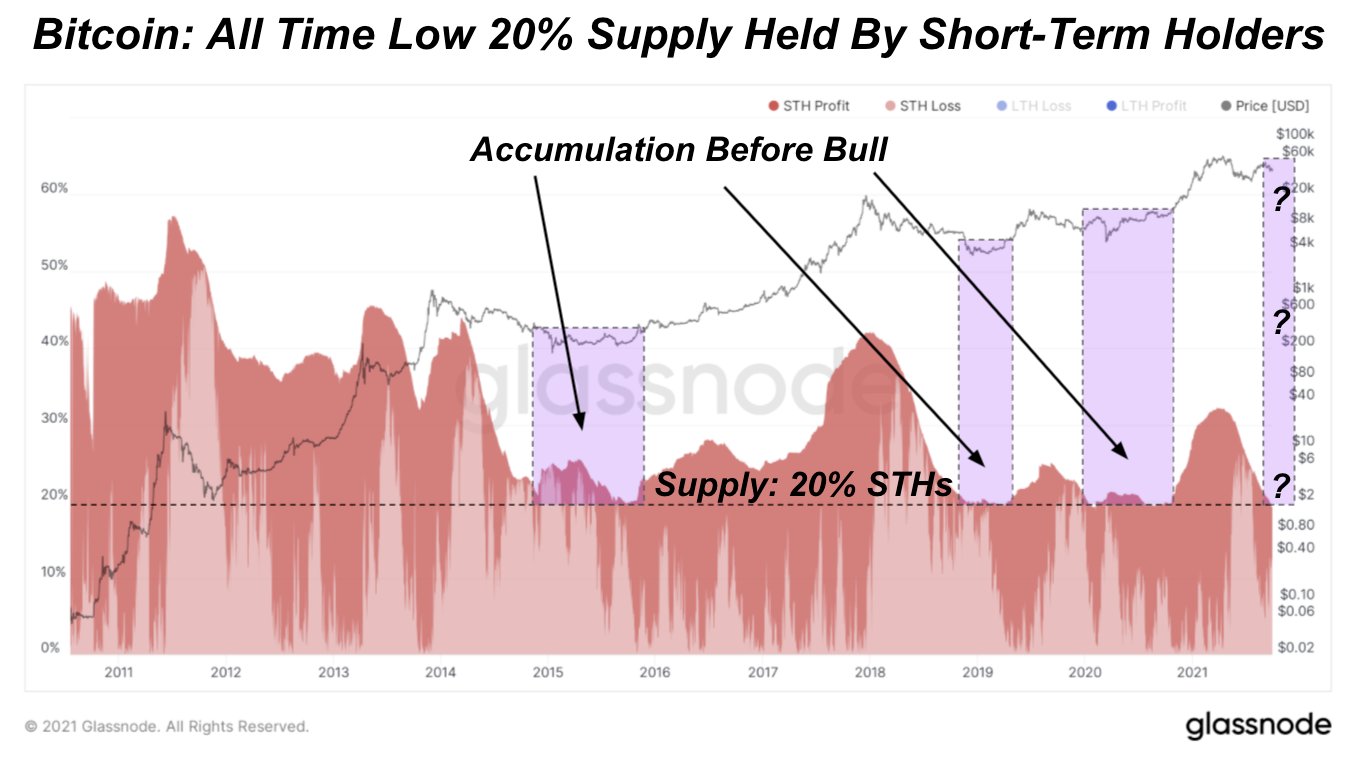
So while the price is ranging, and the "chart looks ugly", smart money is happily accumulating.
Think of a spring slowly being compressed...

10. This chart is the proverbial spring. The higher the LTH supply goes, the larger the squeeze will be when it finally comes.
Any long-term holder today has at the very least held through an over 50% drawdown from the April ATH.
Volatility does not phase these participants.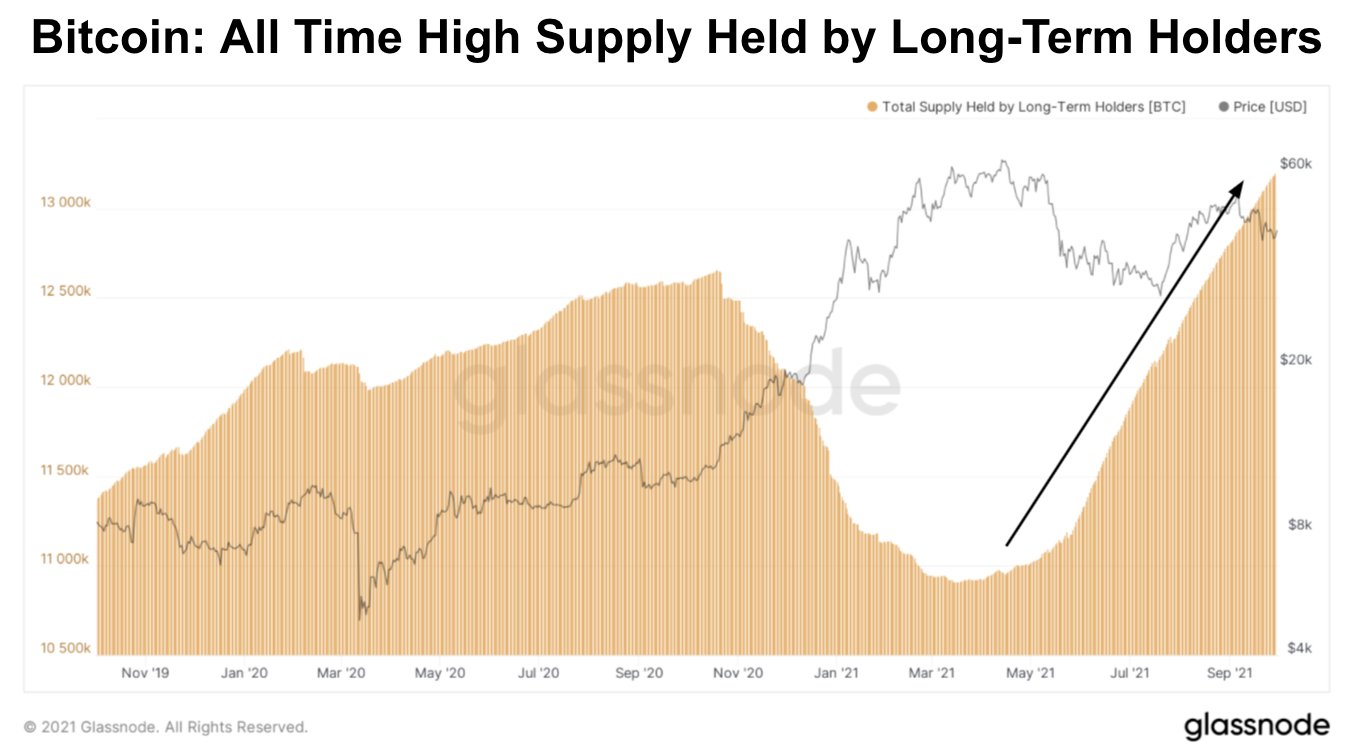
Any long-term holder today has at the very least held through an over 50% drawdown from the April ATH.
Volatility does not phase these participants.

11. TLDR: The lower the Short-Term:Long-Term Realized Price Ratio goes the more bullish I will become.
In the end, all bears will die.
In the end, all bears will die.
12. If you enjoyed these insights, I put together a daily newsletter for @BitcoinMagazine called The Deep Dive with @samjrule, covering bitcoin on-chain analytics, derivative markets, and global macroeconomics.
Try out the first 3-months for $10/month! 🤟checkout.stripe.com/pay/cs_live_b12L0v2ZMNeOQJ5P9fvlZtdcrvy6P7pJqH7VRgaDAGHbb75u7bmj4251va
Try out the first 3-months for $10/month! 🤟checkout.stripe.com/pay/cs_live_b12L0v2ZMNeOQJ5P9fvlZtdcrvy6P7pJqH7VRgaDAGHbb75u7bmj4251va
Discount code: BULLISH 📈🚨