


Policy Significance Statement
Information policy involves not only laws and policy documents, but also digital infrastructures and online devices. Taking the case of open data portals, this article examines three approaches for studying the configuration of such devices: (a) interface analysis, (b) software analysis, and (c) metadata analysis. These approaches may support learning around how open data policy aims are translated into software and infrastructure, and may be used to assess effectiveness, surface limitations, and to inspire experimentation with alternative arrangements.
1. Introduction
The past decade has seen the rise of “data portals” as online devices for making data public. They have been accorded a prominent status in political speeches, policy documents, and official communications as sites of data-driven innovation, transparency, accountability, and participation. If data portals may be envisaged as sites where the relations between citizens, states, and data materialize (Ruppert, Reference Ruppert, Rottenburg, Merry, Park and Mugler2015), then how can we approach them as objects of study? How may they be empirically re-specified (Marres, Reference Marres2012), and even put back together differently?
Drawing on research on a selection of data portals from around the world, open source data portal software, and associated online spaces and infrastructures, this paper explores three approaches for studying the social life of data portals as online devices: (a) interface analysis, (b) software analysis, and (c) metadata analysis. These three approaches contribute to the study of the social lives of data portals as dynamic, heterogeneous, and contested sites of public sector datafication. As well as facilitating the empirical respecification of data portals as sites of material participation (Marres, Reference Marres2012), critical engagements with data portal interfaces, metadata, and software may also inform the rethinking and recomposition of these infrastructures, as well as the relations and forms of life that they sustain. Device-sensitive approaches and methods often used to study private sector platform practices may also be drawn upon to evaluate the politics of public sector data innovation, and open up space for more inclusive, diverse, effective, and redistributive interventions.
2. Background
2.1. Data portal imaginaries, aspirations, and disappointments
What are data portals for? What is it hoped, promised, and expected that they will do? Different kinds of visions and promises associated with data portals can be traced on the web and online spaces. Some of the more bold and ambitious claims and aspirations may be found in archives of official announcements, political speeches, and press materials. Materials associated with the launches of the US’s data.gov and the UK’s data.gov.uk provide a sense of some of these earlier hopes, as well as subsequent disappointments. On the launch of the Data.gov, Vivek Kundra, the first Federal Chief Information Officer of the United States wrote: “The goal of Data.gov is to enable better decision-making, drive transparency, and help to power innovation for a stronger America.”Footnote 1 About pages May 2009 state the goals of the site are to “encourag[e] innovative ideas,” “make government more transparent,” create an “unprecedented level of openness in Government,” “strengthen our Nation’s democracy” and to “promote efficiency and effectiveness in Government.”Footnote 2
On the launch of the UK’s Data.gov.uk, Tim Berners-Lee, widely known as the inventor of the World Wide Web and founder of the World Web Foundation and the Open Data Institute, commented that it would: “unlock new ideas for delivering public services, help communities and society work better, and let talented entrepreneurs and engineers create new businesses and services.”Footnote 3 The then government minister for Digital Britain contended that Data.gov.uk was “a cornerstone of how to strengthen the role of citizens and government, and recast the relationship between the two” and “a remarkable transformation in the availability of information to the public.”Footnote 4 Then Prime Minister Gordon Brown said that the UK’s data portal would contribute to “breaking down the walled garden of government, using technology and information to provide greater transparency on the workings of Whitehall and give everyone more say over the services they receive.”Footnote 5
These kinds of aspirations may be considered in relation to broader histories of open data as a malleable idea whose meaning is continually reconfigured in relation to shifting conceptions of governance and democracy (Gray, Reference Gray2014). To the extent that these kinds of promises become socially shared and institutionally operative, they may be considered as “data imaginaries” (Rieder, Reference Rieder, Sætnan, Schneider and Green2018; Ruppert, Reference Ruppert2018; Gray, Reference Gray2018b; Lehtiniemi and Ruckenstein, Reference Lehtiniemi and Ruckenstein2019; Tupasela et al., Reference Tupasela, Snell and Tarkkala2020; Leonelli, Reference Leonelli2021).Footnote 6 Different ideas about what data portals can achieve are encoded into more or less durable, shared understandings which may guide action. Data portals can be envisaged as part of what it means to deliver on broader promises or commitments to transparency, openness, participation, and innovation, such as when Obama’s Open Government Directive stipulated that datasets should be registered on data.gov within 45 days; when the then G8 Open Data Charter included data portals as part of commitments to “open data by default”; or when members of the Open Government Partnership highlight open data portals as part of their national action plans.Footnote 7 In this sense data portals may also be understood in relation to performances of transparency (Currie, Reference Currie2020).
Data portals also show up as part of commitments not just to openness but also taking action on issues. In the Obama archives Data.gov is mentioned in relation to better serving Asian Americans and Pacific Islander (AAPI) communities, protecting students from sexual assault, improving coastal planning, preparing for the effects of climate change and supporting civic participation through a National Day of Civic Hacking.Footnote 8 In the UK, one finds data.gov.uk turning up in relation to commitments to scrutinizing public finances with “armchair auditors” and cutting government spending, energy waste, more responsive public services, economic growth, improved transport, commercial innovation, tax transparency, public sector reform, and international open government commitments (Gray, Reference Gray2014).Footnote 9
As well as institutional data imaginaries, one can also look at how data portals are envisioned by activists, hackers, and civil society groups involved in making and using them. Data.gov and data.gov.uk are both run using the open-source CKAN software which preceded both portals.Footnote 10 The project started around 2007 as a “web application to manage listings of knowledge packages” hosted at the Open Knowledge Foundation, a non-profit organization dedicated to “promoting the openness of knowledge in all its forms.”Footnote 11 CKAN stands for the “Comprehensive Knowledge Archive Network,” an allusion to software repositories such as the “Comprehensive Perl Archive Network” (CPAN) or the “Comprehensive TeX Archive Network” (CTAN). These kinds of software projects serve as lists and registries of free/open-source software packages, libraries and components. They have been accorded a prominent role in free/open source developer and user communities, and reflect visions and practices of free/open source software development.
Interviews with contributors and materials associated with the development of the CKAN project suggest several ways in which the project has drawn inspiration from free/open source software development practices.Footnote 12 Firstly, the practice of software “packaging” or “componentization” is said to enable large, complex, and specialized software projects to be broken down into smaller components that can be used across multiple different projects and settings. Second, software registries can facilitate computer-assisted and semi-automated ways of working with data through accompanying command line tools––such as “apt get”––which support installation, package management, interfacing with other software packages and many other tasks. Thirdly, software registries facilitate distributed collaboration around the development of code––including basic social features as well as “versioning” to track and manage changes and contributions.
The transposition of these different valued features of free/open source software development led to the development of “data packages” and discussions of data “packaging” and “componentization” (complete with metaphors of shipping containers, logistics, physical production processes, and supply chains). A set of libraries and command line features for data portals led the project to be initially described as “apt-get for data” at the leading Chaos Communication Congress in Berlin.Footnote 13 The project was framed as a contribution to enabling “collaborative data ecosystem” by facilitating contributions to a common set of datasets from a distributed set of actors, often with different projects and interests. For example, one “data wrangler” could download, clean up, reformat, or combine different datasets, and re-upload them, saving others from doing this same time-consuming or tedious data work.
Just as with software, the integrity of these kinds of incremental and collaborative knowledge development was envisaged to be underpinned by “versioning.” A “versioned domain model” for the CKAN project––described as a “wiki-like interface”––was intended to enable contributors to keep track of changes not only in relation to datasets and their associated metadata, but also the data portal software itself. This was intended to enable more collaborative, transparent, and reliable “data work,” as more people could work together around fewer shared components which would benefit from multiple improvements and increased scrutiny across projects (as per the moniker “many eyes make shallow bugs”).
Archived web pages from the Wayback Machine can provide a flavor of the evolution of these earlier data imaginaries. The initial CKAN software was deployed on a website called “ckan.net” which in 2007 was described as a “register” (explicitly in the vein of the CPAN and “freshmeat” software projects) enabling anyone to find or create “open knowledge packages.” By 2010, the front page says “this site makes it easy to find, share and reuse content and data, especially in ways that are machine automatable.” By 2011 the site was renamed “The Data Hub” (thedatahub.org) and described as “the easy way to get, use and share data.” By 2013 the site’s front page (now at datahub.io) offered the following: “Give your data a home: Publish or register datasets, create and manage groups and communities.”
The first public instance of the CKAN software may thus be considered as a kind of “infrastructuring” device––to assemble data publics and to facilitate distributed collaboration between them around an open knowledge “ecosystem” or “commons.” This includes the aspiration that actors spread out across space, time, and in different settings could nevertheless contribute to enriching a shared pool of informational resources, facilitating a wide range of societal benefits. This genre of socio-technical imaginary can be read in relation to previous research on free/open source software development––including social studies of the values, imaginaries, and practices of free and open-source software communities (Kelty, Reference Kelty2008; Tkacz, Reference Tkacz2012).
Perhaps not surprisingly given the scope, ambition, and implications of these various hopes and promises, data portals have not infrequently been met with disappointment, suspicion, and critique from many quarters. Some critique how data portals are implicated in broader problematic ideologies of transparency. For example, in a 2012 piece for The New Inquiry, Sarah Leonard writes of how government data portals and transparency activist groups such as Wikileaks both advocated the “virtuous data dump” which “swamps our capacity to make sense of it and becomes obfuscatory” and “makes it easy for states and social-media corporations to turn the tables and rationalize their relentless invasion of our privacy” (Leonard, Reference Leonard2012). Clare Birchall writes of how data portals and the open data initiatives with which they are associated call upon us to take on the “imaginary identity of the ideal data subject as a citizen–auditor–consumer–entrepreneur” in “info-capitalist-democracy,” and suggests their spread may be viewed as a kind of “transparency imperialism” (Birchall, Reference Birchall2015).
Some raise concerns about how open data initiatives, and the data portals which play a prominent role in them, may have problematic effects––such as “empowering the empowered” if data portals and open data initiatives are not accompanied by further measures to enable “effective use” (Gurstein, Reference Gurstein2011); serving as a Trojan horse for new public management (Longo, Reference Longo2011); promoting the marketization of public services (Bates, Reference Bates2012); and being plundered by “free market doppelgängers” which “follow civic hackers wherever they go” (Slee, Reference Slee2012). Data users have also highlighted data portal shortcomings. In 2010 the Guardian reported developer community disappointment that postcode files were not made available for non-profits following the launch of data.gov.uk, and in 2011 that data published on the site had not been useful or provided “value to people in their day-to-day lives.”Footnote 14 A 2015 Nieman Lab piece on data.gov highlighted comments from journalists, transparency advocates, and developers that datasets were “old,” “irrelevant” and infrequently updated, that important datasets were missing (e.g., election results), and the portal does not make data accessible for broader publics.Footnote 15 A recent review of literature on data portals suggests that literature is “almost universally critical, albeit often also constructive” and suggests an “expectations gap” between different aims and the “limitations, faults and unfulfilled promise of portals,” including shortcomings related to machine-readable data, transparency impacts and broader accessibility (Davies, Reference Davies2021).
2.2. Data portals as online devices
In light of these various expectations and disappointments, how can data portals be studied? Against which and whose expectations should data portals be evaluated? How can we study not only what has been said about them (whether statements of hope or frustration), but also their material organization and computational affordances? As recent reviews attest, there are many ways of studying open data portals from a wide variety of disciplinary perspectives––including computer science, information management, political science, public administration (Davies, Reference Davies2021). A not insignificant body of literature has been dedicated to developing assessment frameworks (Alexopoulos et al., Reference Alexopoulos, Diamantopoulou, Charalabidis, Janssen, Axelsson, Glassey, Klievink, Krimmer, Lindgren, Parycek, Scholl, Trutnev and Trutnev2017; Machado et al., Reference Machado, Mantini, Viterbo, Bernardini and Barcellos2018) and evaluating data portals en masse with various methods and measures from metadata quality (Neumaier et al., Reference Neumaier, Umbrich and Polleres2016) to usability scoring (Nikiforova and McBride, Reference Nikiforova and McBride2021).
This paper focuses on what social and cultural research grounded in fields such as science and technology studies and internet studies might contribute. Methodologically other studies in these fields have undertaken interviews (Boucquey et al., Reference Boucquey, Martin, Fairbanks, Campbell and Wise2019) and ethnographies (Ratner and Ruppert, Reference Ratner and Ruppert2019) ––as well as exploring how ethnographic approaches can be combined with digital methods (Burns and Wark, Reference Burns and Wark2020). In complement to such approaches, this article examines ways of studying data portals as online devices, inspired by the approach of digital methods studies in this area, such as on the role of web trackers and coding platforms in news work (Bounegru, Reference Bounegru2019) and the temporalities of “real-time” web devices such as search engines and social media platforms (Weltevrede et al., Reference Weltevrede, Helmond and Gerlitz2014). These studies draw on and are grounded in research attending to devices in science and technology studies (STS), in particular work on how devices acquire political capacities and take part in politics and public life (Marres, Reference Marres2011, Reference Marres2012; Marres and Lezaun, Reference Marres and Lezaun2011); how digital devices are involved in producing and performing contemporary sociality through their reconfiguration of knowledge spaces (Law and Ruppert, Reference Law and Ruppert2013; Ruppert et al., Reference Ruppert, Law and Savage2013); and “market devices,” “material and discursive assemblages that intervene in the construction of markets,” such as pricing models, trade protocols and economic indicators (Callon et al., Reference Callon, Millo and Muniesa2007).
Research on “transparency devices”––such as transparency agendas, conflict maps, and administrative protocols––proposes that “sociotechnical devices should be understood not simply as ‘gadgets’ that do things but as complex and unstable assemblages that draw together a diversity of people, things and concepts in the pursuit of particular purposes, aims, and objectives” (Harvey et al., Reference Harvey, Reeves and Ruppert2013). Ruppert proposes that devices associated with the UK’s transparency agenda can be understood as part of a process of “enacting the transparent state” (Ruppert, Reference Ruppert, Rottenburg, Merry, Park and Mugler2015). Also highly relevant to the approach of this article is research on “transparency as political device”––looking not just at “talk about transparency,” but also “localized and technical” practices such as displays of accounts, the conventionalization of conduct through guidebooks and the gathering of witnesses (Barry, Reference Barry, Akrich, Barthe, Muniesa and Mustar2013). Similarly, Hansen and Flyverbom propose to “look carefully at the contingencies of transparency, and at how it is produced” including through what they call “disclosure devices”: mediating technologies involved in the production of transparency, such as due diligence, rankings, and big data analysis (Hansen and Flyverbom, Reference Hansen and Flyverbom2015; Flyverbom, Reference Flyverbom2016).
Device-sensitive approaches have also been taken up in the study of policy––including with the notion of “policy devices” (Hirschman and Berman, Reference Hirschman and Berman2014; Frankel et al., Reference Frankel, Ossandón and Pallesen2016; Gray, Reference Gray2017). For example, Hirschmann and Berman look at the complementary notion of “policy devices” which they suggest includes: “the wide variety of sociotechnical tools that help policymakers see and make decisions about the world,” giving examples of GDP, unemployment rates, and censuses, arguing that “policy devices shape what we attend to” (Hirschman and Berman, Reference Hirschman and Berman2014).
To consider how data portals can be studied as online devices, therefore, implies looking at them as dynamic, contingent, shifting, and unstable socio-technical assemblages which are conferred with political capacities, which take part in political life, which script collective action and relations and which shape how things are made intelligible. STS work on devices emphasizes how they may be understood as “patterned arrangements” which are have “social lives” in the sense that they are both shaped by the social and format social relations (Law and Ruppert, Reference Law and Ruppert2013). In what follows, I explore how data portals may be studied as online devices with such sensibilities. While many previous studies of data portals have involved large-scale data analysis, scraping, and analysis of interface features, the approaches below aim to repurpose online materials and attempt to re-configure online devices for the purposes of interpretive research on digitally mediated sociality and culture (Rogers, Reference Rogers2013; Marres, Reference Marres2017). They are proposed as methodological entry-points for the study of data portals, illustrated through engagements with a selection of portals from around the world as well as the open source CKAN software which many portals use, notably data.gov and data.gov.uk which are two of the earliest and most widely mentioned examples in research, practitioner and policy literature.
3. Studying Data Portals as Online Devices
3.1. Interface analysis
Data portals may be studied through the interfaces that are presented upon visiting them. Such interfaces may be considered to configure users (Woolgar, Reference Woolgar1990) and guide conduct (Light et al., Reference Light, Burgess and Duguay2018). Software studies and new media scholars have examined how interfaces script and order interactions and relations between hardware, software, data, and users (Pold, Reference Pold2005; Cramer and Fuller, Reference Cramer, Fuller and Fuller2008; Andersen and Pold, Reference Andersen and Pold2011, Reference Andersen and Pold2018; Galloway, Reference Galloway2012; Chun, Reference Chun2013; Hookway, Reference Hookway2014). Interfaces can be understood to be political in the sense that they produce particular kinds of users (Chun, Reference Chun2013) and can be viewed as “zones of contestation” where human-machine relations are negotiated (Hookway, Reference Hookway2014). Interfaces may be envisaged to infrastructure publics (Dantec and DiSalvo, Reference Dantec and DiSalvo2013) and format broader societal engagement with datasets (de Mourat et al., Reference de Mourat, Ricci, Latour, Eve and Gray2020). Dourish contends that interfaces can be viewed as “objects that structure and organize the world around us in meaningful ways” (Dourish, Reference Dourish2007).
How to study data portal interfaces? Drawing on a common distinction in web development, Richard Rogers distinguishes between the “front end” and “back end” of information politics––with the latter including “information formatting” and what is presented to the user and the latter including “information retrieval” techniques such as “search engine logics” (Rogers, Reference Rogers2004). We may start by looking at the interfaces which are presented to data portal visitors––the presence, absence, and ordering of different kinds of interface elements. This can be explored through repurposing the method of “reverse wireframing.”Footnote 16 Wireframing is a practice of establishing and arranging the basic elements of a page for the purposes of user interface design, development, and testing. It is often used to “mock up” the composition of various elements––whether with wireframing software or through paper prototyping. “Reverse wireframing” can be used as a technique to analyze and decompose the basic elements of a web page. For example, Figure 1 shows a reverse wireframe of data.gov, created using the “wirify” bookmarklet which lets users “turn any web page into a wireframe in one click.”Footnote 17
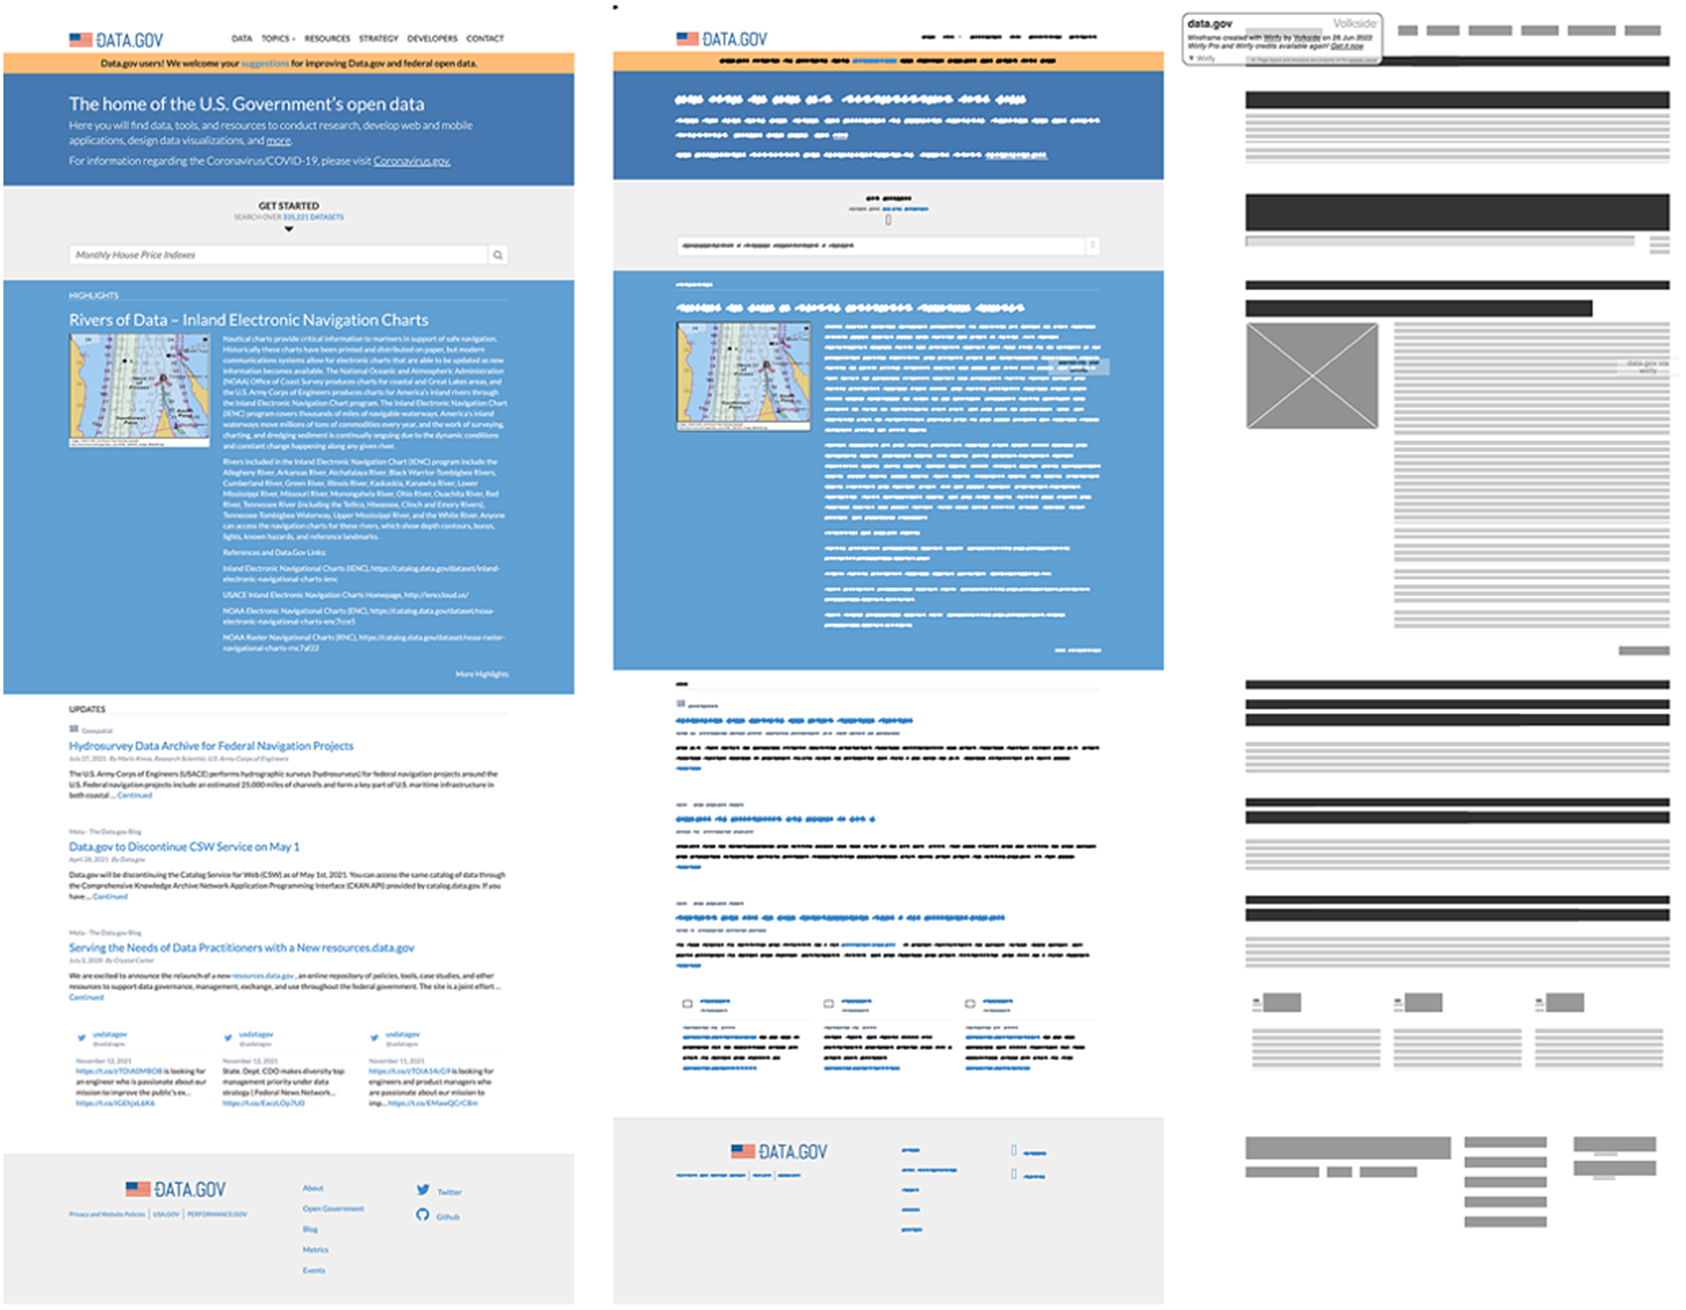
Figure 1. Front page of data.gov—original (left), obfuscated text (middle), wire frame outline (right).
On the front page of data.gov one can see (from the top): a top menu bar (including a link to the “catalog” powered by CKAN, data topics, developer pages, and contact form, a link to a feedback form, a one-line summary (“the home of the U.S. Government’s open data”), a count of total datasets (“search over 335,221 datasets”), a search bar with rotating search suggestions (“Monthly House Price Indexes,” “Health Care Provider Charge Data,” “Credit Card Complaints,” “Manufacturing & Trade Inventories & Sales,” “Federal Student Loan Program Data”), highlighted datasets, embedded recent blog updates, embedded recent Twitter posts and a footer with links.
Drawing on digital methods research on doing web histories with the Wayback Machine (Rogers, Reference Rogers2017), monthly snapshots of the front page of Data.gov.uk tell a story about how the site has developed (Figure 2).
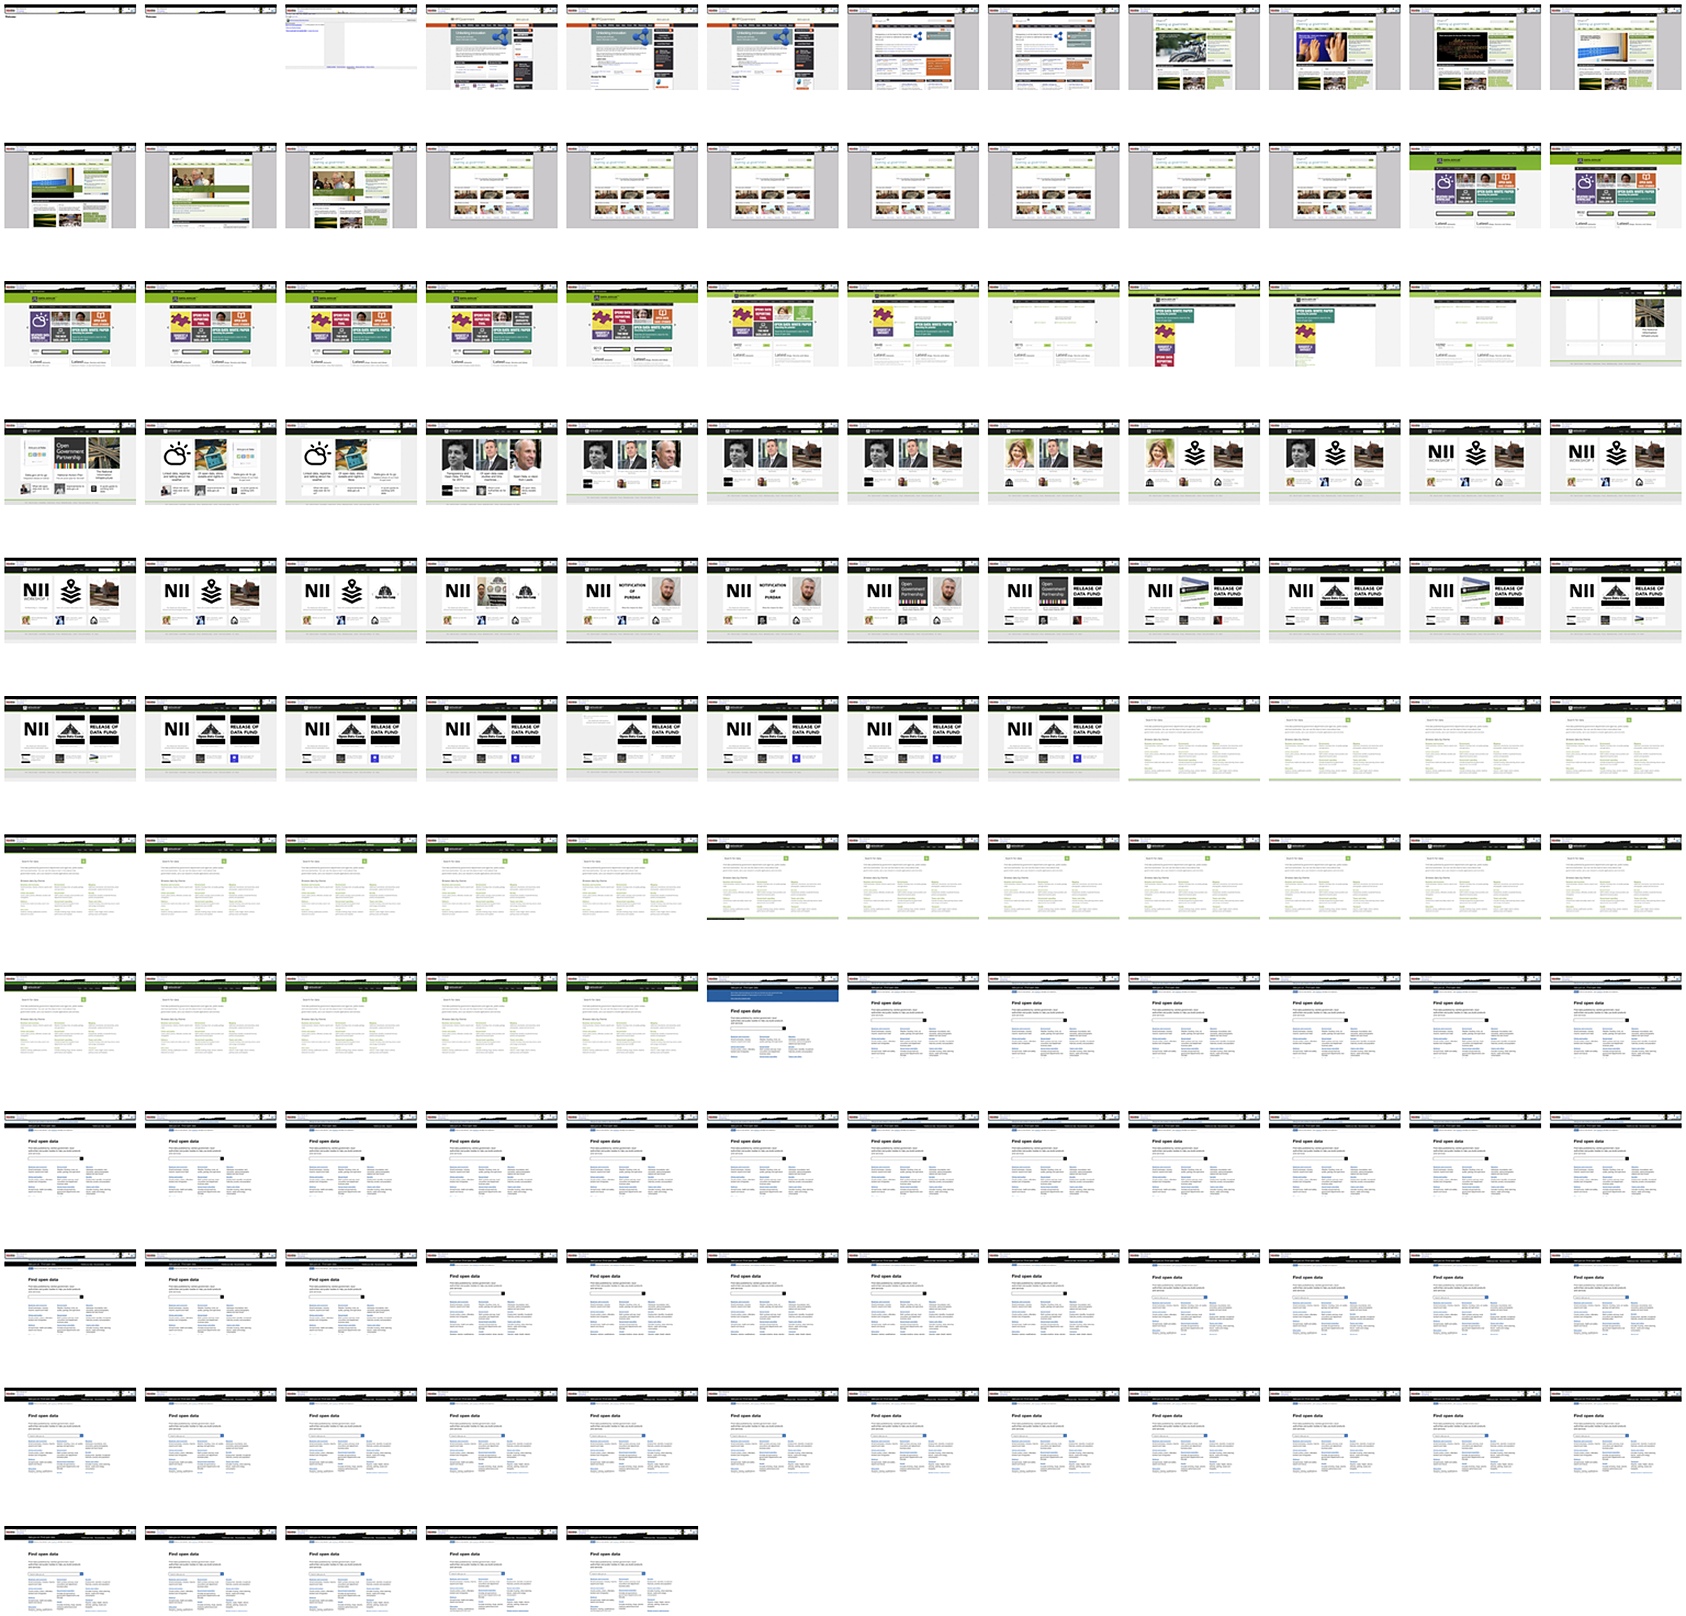
Figure 2. Snapshots of data.gov.uk front page by month according to captures from Internet Archive’s Wayback Machine (2009–2022). An animated version can be found at: https://vimeo.com/720658997.
Data.gov.uk is comprised of a shifting set of interface elements. It is described as being in “perpetual beta” (a term associated with Web 2.0 as formulated by Tim O’Reilly) in which “best practice, technical development, innovative use of data, and citizen-centric politics combine to drive data-release programs” (Shadbolt et al., Reference Shadbolt, O’Hara, Berners-Lee, Gibbins, Glaser, Hall and Schraefel2012).Footnote 18 In this sense, the changes in Data.gov.uk are envisaged as part of a process of experimentation to generate societal value through the re-use of government data. From its launch in 2009 to 2022 there have been at least nine major interface changes, from private beta to trying many social web features to paring back to a simple search and browse interface with the official Government Digital Service theme:
-
• Jul 2009-Dec 2009: “Private beta.” Empty page with “Welcome” followed by redirection to private “UK Government Data Developers” Google Group.
-
• Jan 2010-Sep 2010: “Unlocking innovation.” Semantic web innovation and web 2.0, with SPQARL endpoint and site sections for “Apps,” “Ideas,” “Forum,” “Wiki” and prominent social media links.
-
• Oct 2010-Nov 2010: “Transparency is at the heart of this Government.” Rebrand with same social web elements. Linked data moved down, apps moved up. Highlighting of spending data.
-
• Dec 2010-Jun 2011: “Opening up government.” Transparency has been taken off the main menu. Prominent texts on “Who is who in government and where does the money go?” and “Facts, figures, apps and more.” Showcasing apps. Guidance for data publishers. Call for developers to request datasets.
-
• Jul 2011-Jun 2012: “Enter your postcode.” Location-based search box to find “tools and information about your local area using government data.”
-
• Jul 2012-Oct 2013: “Latest datasets, blogs, forums, and ideas.” Rotating carousel, search boxes for data and content, total dataset count (from 8600 to 10,200).
-
• Nov 2013-Jul 2016: “National information infrastructure.” Revamp coinciding with UK hosting Open Government Partnership. National information infrastructure and Open Government Partnership UK National Action Plan. Data portal as transparency showcase. Top menu simplified to “data,” “apps” and “interact.” Menu items for forum, data requests, and linked data are removed.
-
• Aug 2016-Apr 2018: “Search for data.” Main items on page are big search box, plus “browse data by theme” with twelve suggested topics––the order of which suggests how role of state is envisioned (business and economy, crime and justice, defense, education, environment, government, spending, health, mapping, society, towns, and cities and transport).
-
• May 2018–May 2022: “Find open data.” Rethemed to match Government Digital Service theme. Emphasis has shifted from process (“search for data”) to outcome (“find open data”). The menu items for “data,” “apps” and “interact” have been removed and replace with “publish your data,” “documentation” and “support” aimed at government departments wishing to publish data, indicating a shift towards supporting data publishing.
While some researchers suggest that portals “mature” towards incorporating more web 2.0 features (Alexopoulos et al., Reference Alexopoulos, Diamantopoulou, Charalabidis, Janssen, Axelsson, Glassey, Klievink, Krimmer, Lindgren, Parycek, Scholl, Trutnev and Trutnev2017), web snapshots of data.gov.uk indicate a process of digital de-socialization and de-experimentalization: the removal of social features and a shift from broader engagement to more minimal site focused on search, browsing, and publishing. From its founding aspirations to elicit ideas, interests, communities, and contexts of potential data usage, the portal transitions towards a pared-down official directory.
As well as looking at interface elements and histories for individual portals, patterns may be detected by looking at the interfaces of multiple portals. Taking screenshots of a selection of 87 national data portals from a register of portals around the world triangulated with other sources and queries, one can observe several shared interface design patterns (Figure 3).Footnote 19
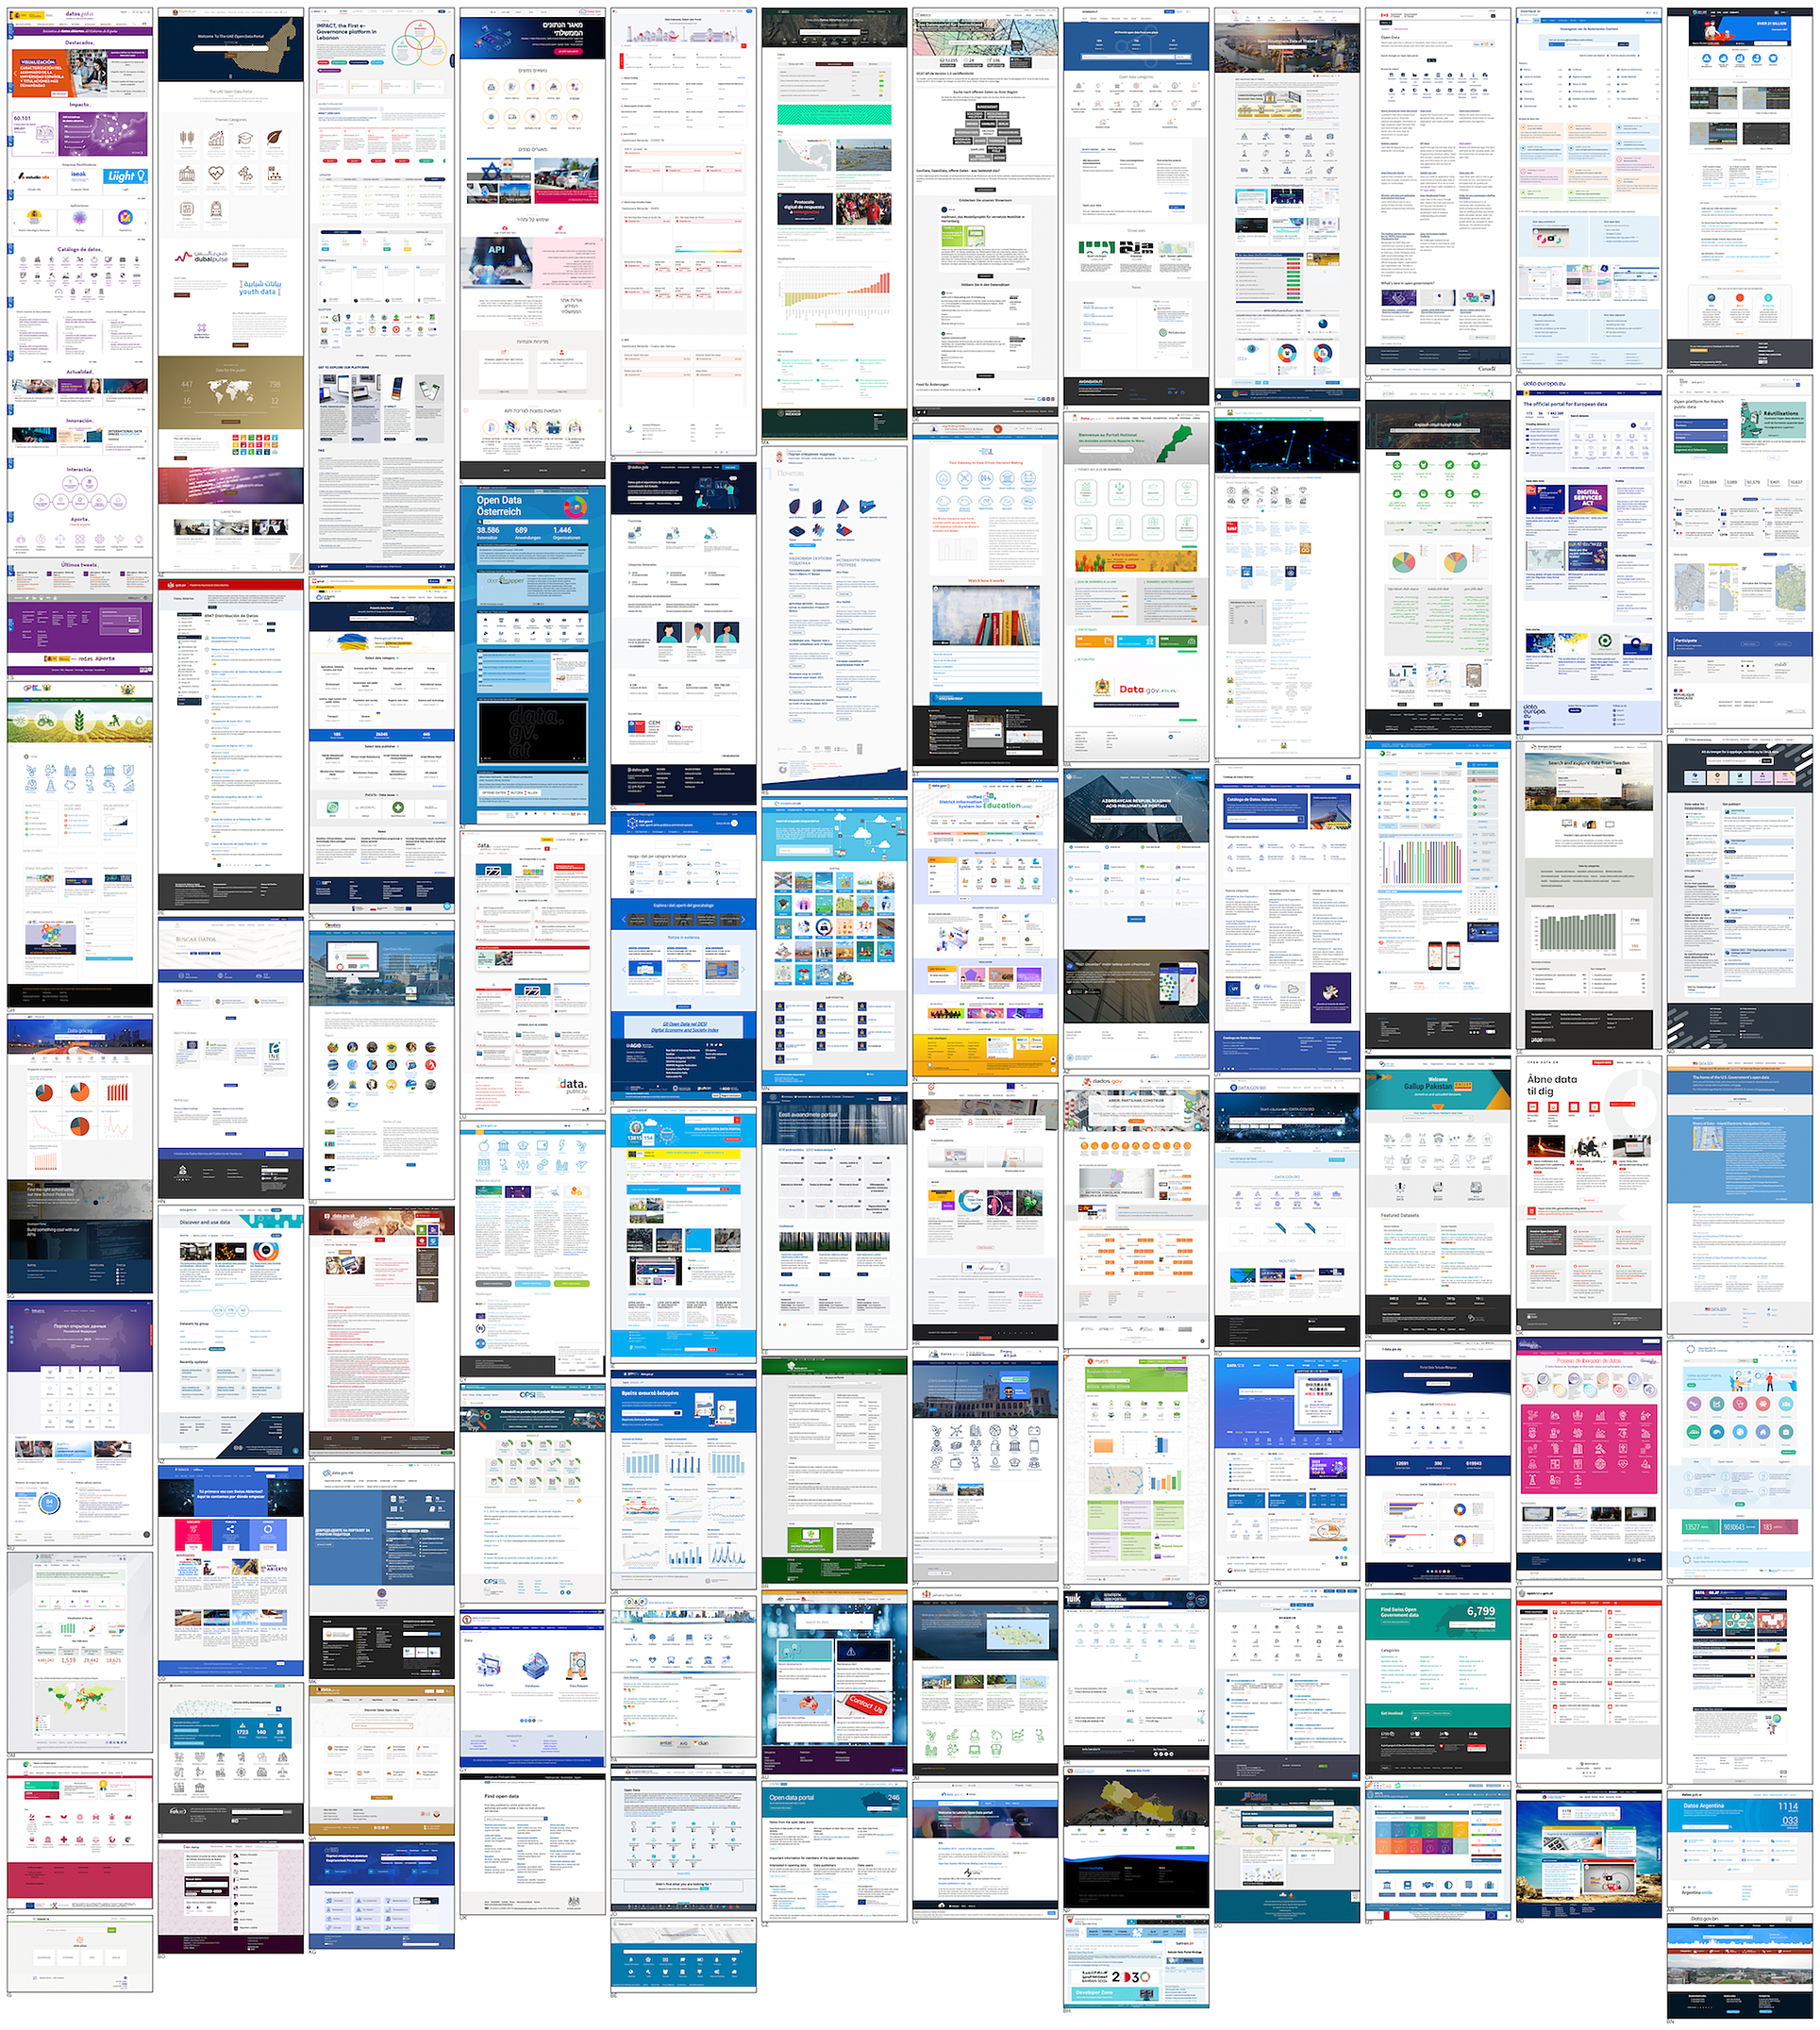
Figure 3. Screenshots of front pages of a selection of 87 national data portals.
Taking this as a way to read portal aesthetics and interface conventions through “non-reductive visualization” (Manovich, Reference Manovich, Hawk, Rieder and Oviedo2008) one can distinguish the prominence of white search bars; icons indicating different data topics; graphs, charts, and visualizations; and content boxes with photos, blog posts, and other news and updates. With a few more colorful exceptions, the dominant palette appears to be composed of shades of grey and blue, which may be taken to suggest a muted and cooler informational aesthetic (Liu, Reference Liu2004), an atmosphere of neutral, official display.Footnote 20
Manually coding the different types of interface features of these 87 portals indicates which features are more and less common, and which are shared by which portals. In doing so we can look beyond individual portals toward shared conventions and styles of configuration (Figure 4).
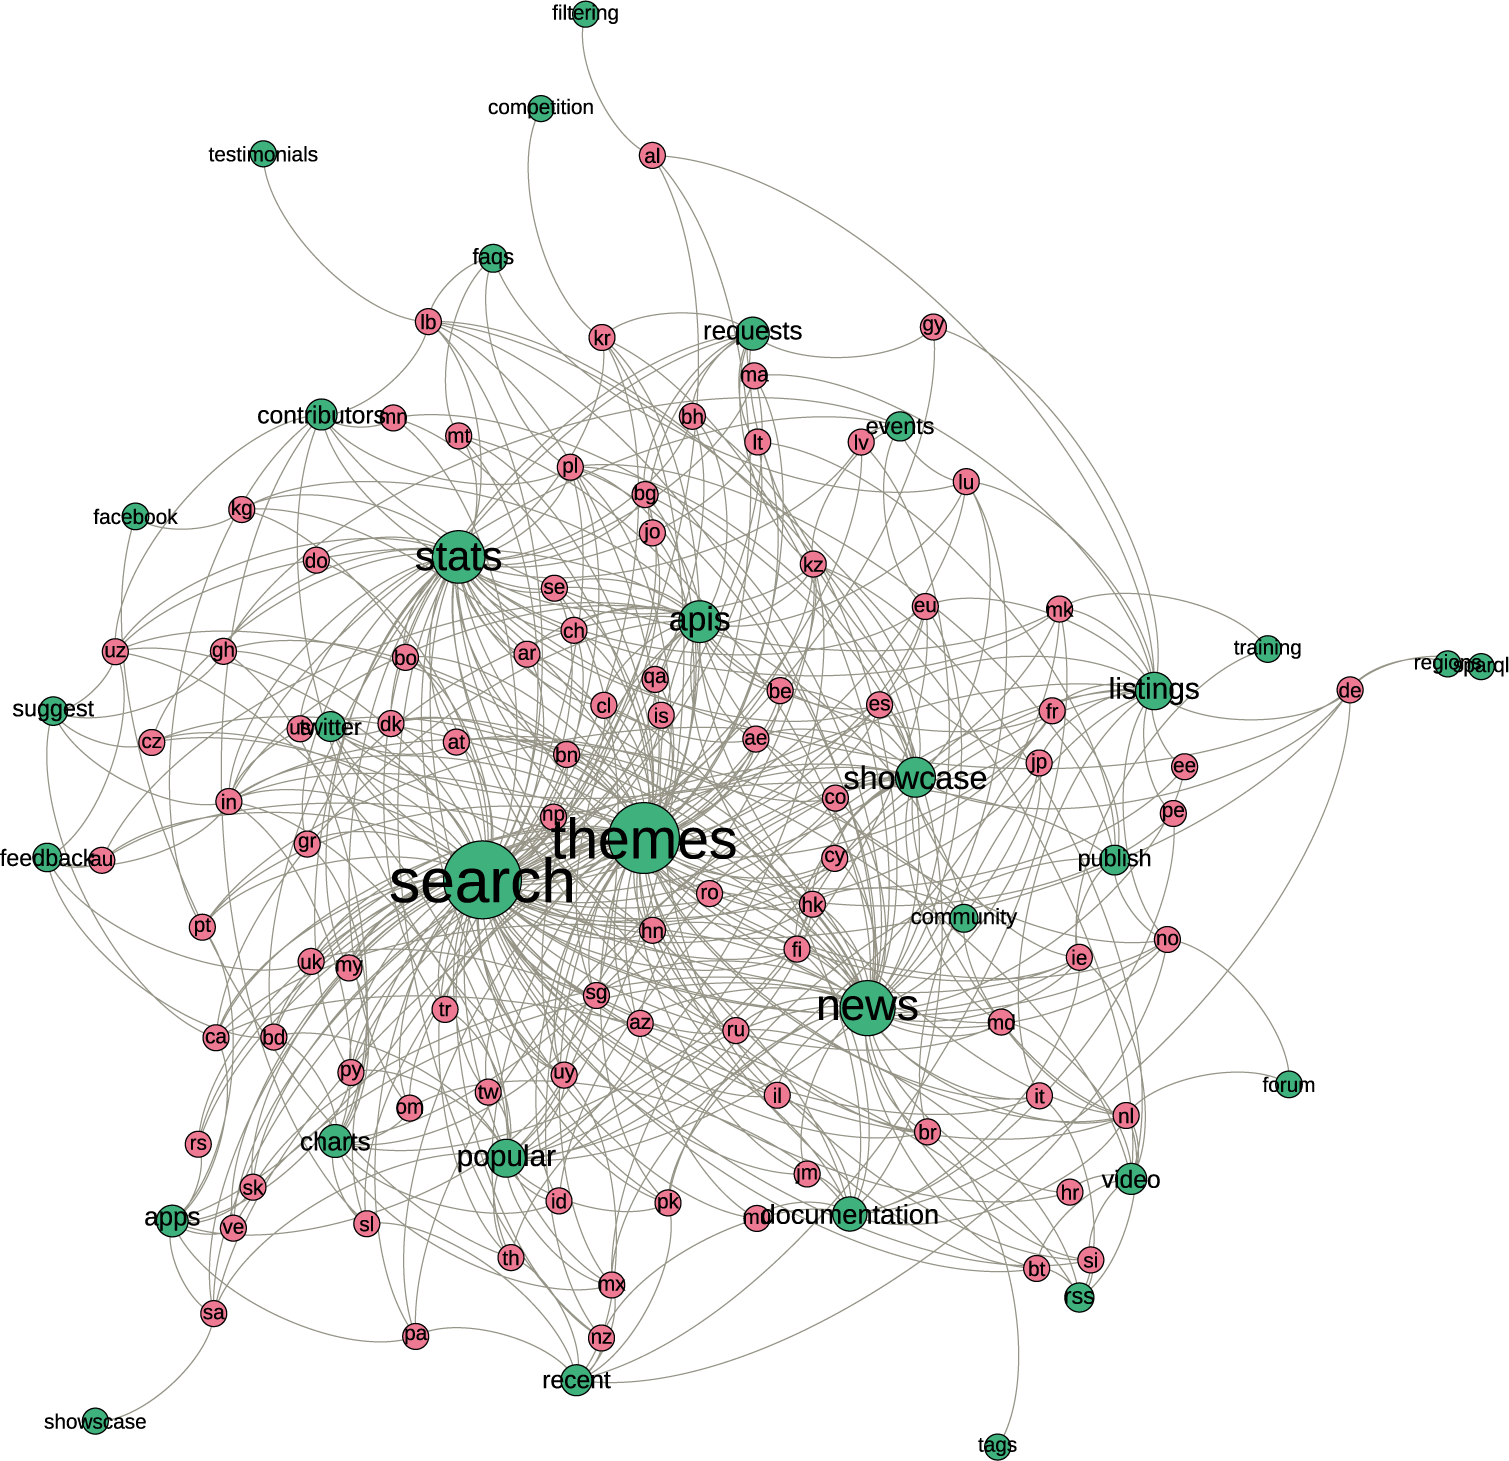
Figure 4. Bi-partite network showing interface features (green) of 87 national data portals (red). Spatialized in Gephi with ForceAtlas2 algorithm (Jacomy et al., Reference Jacomy, Venturini, Heymann and Bastian2014).
As can be observed in the network graph, amongst the most common and widely shared interface elements are search interfaces, taking search boxes as a way to mediate between institutional informational resources and visitor interests: “What are you looking for?” (Figure 5). While in some cases the search boxes are tucked into navigation menus, in others they have been conspicuously placed them in the center of the page––which may be taken as a kind of interface “Googlization,” following the search engine’s pared down landing page.Footnote 21
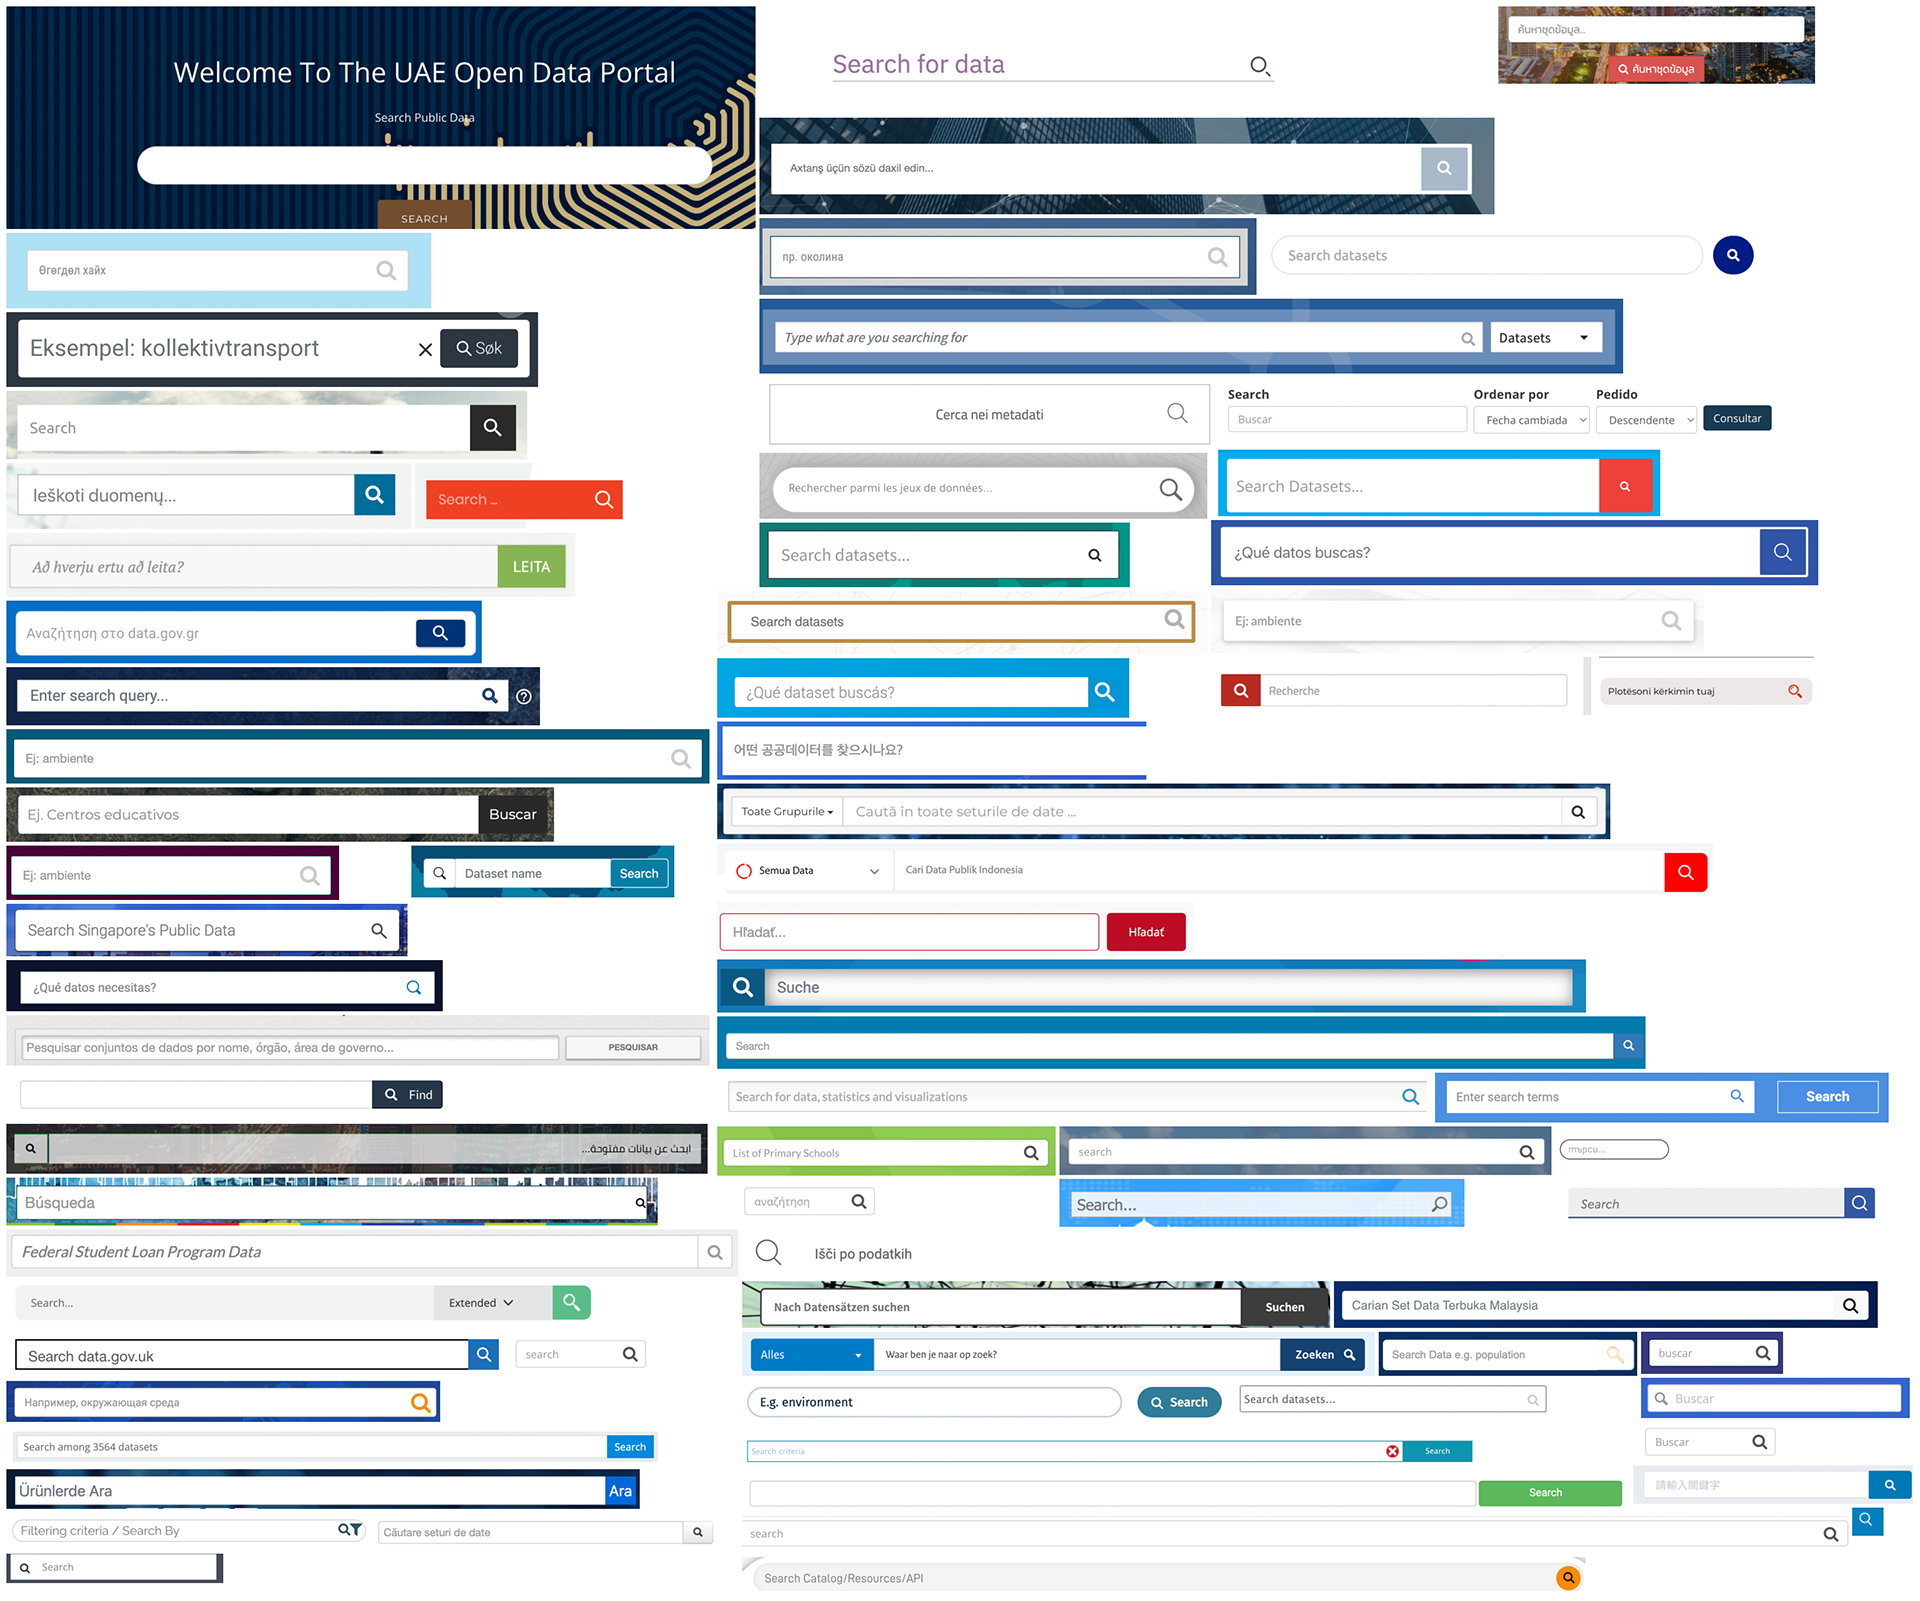
Figure 5. Selection of search prompts from front pages of national data portals.
Many of these portals also feature spreads and grids of data topics, such as “health,” “environment,” “science and technology,” “energy,” “economy,” “justice,” “transport,” “population,” “agriculture,” “education” and “culture” (Figure 6).Footnote 22 The arrays of visual icons are reminiscent of the work of Otto and Marie Neurath’s Isotype Institute: abstracted, encyclopedic, simplified, minimal, accessible visual depictions of different areas of institutional work (Neurath and Kinross, Reference Neurath and Kinross2009). These topical directories complement search interfaces as an entry-point to datasets.
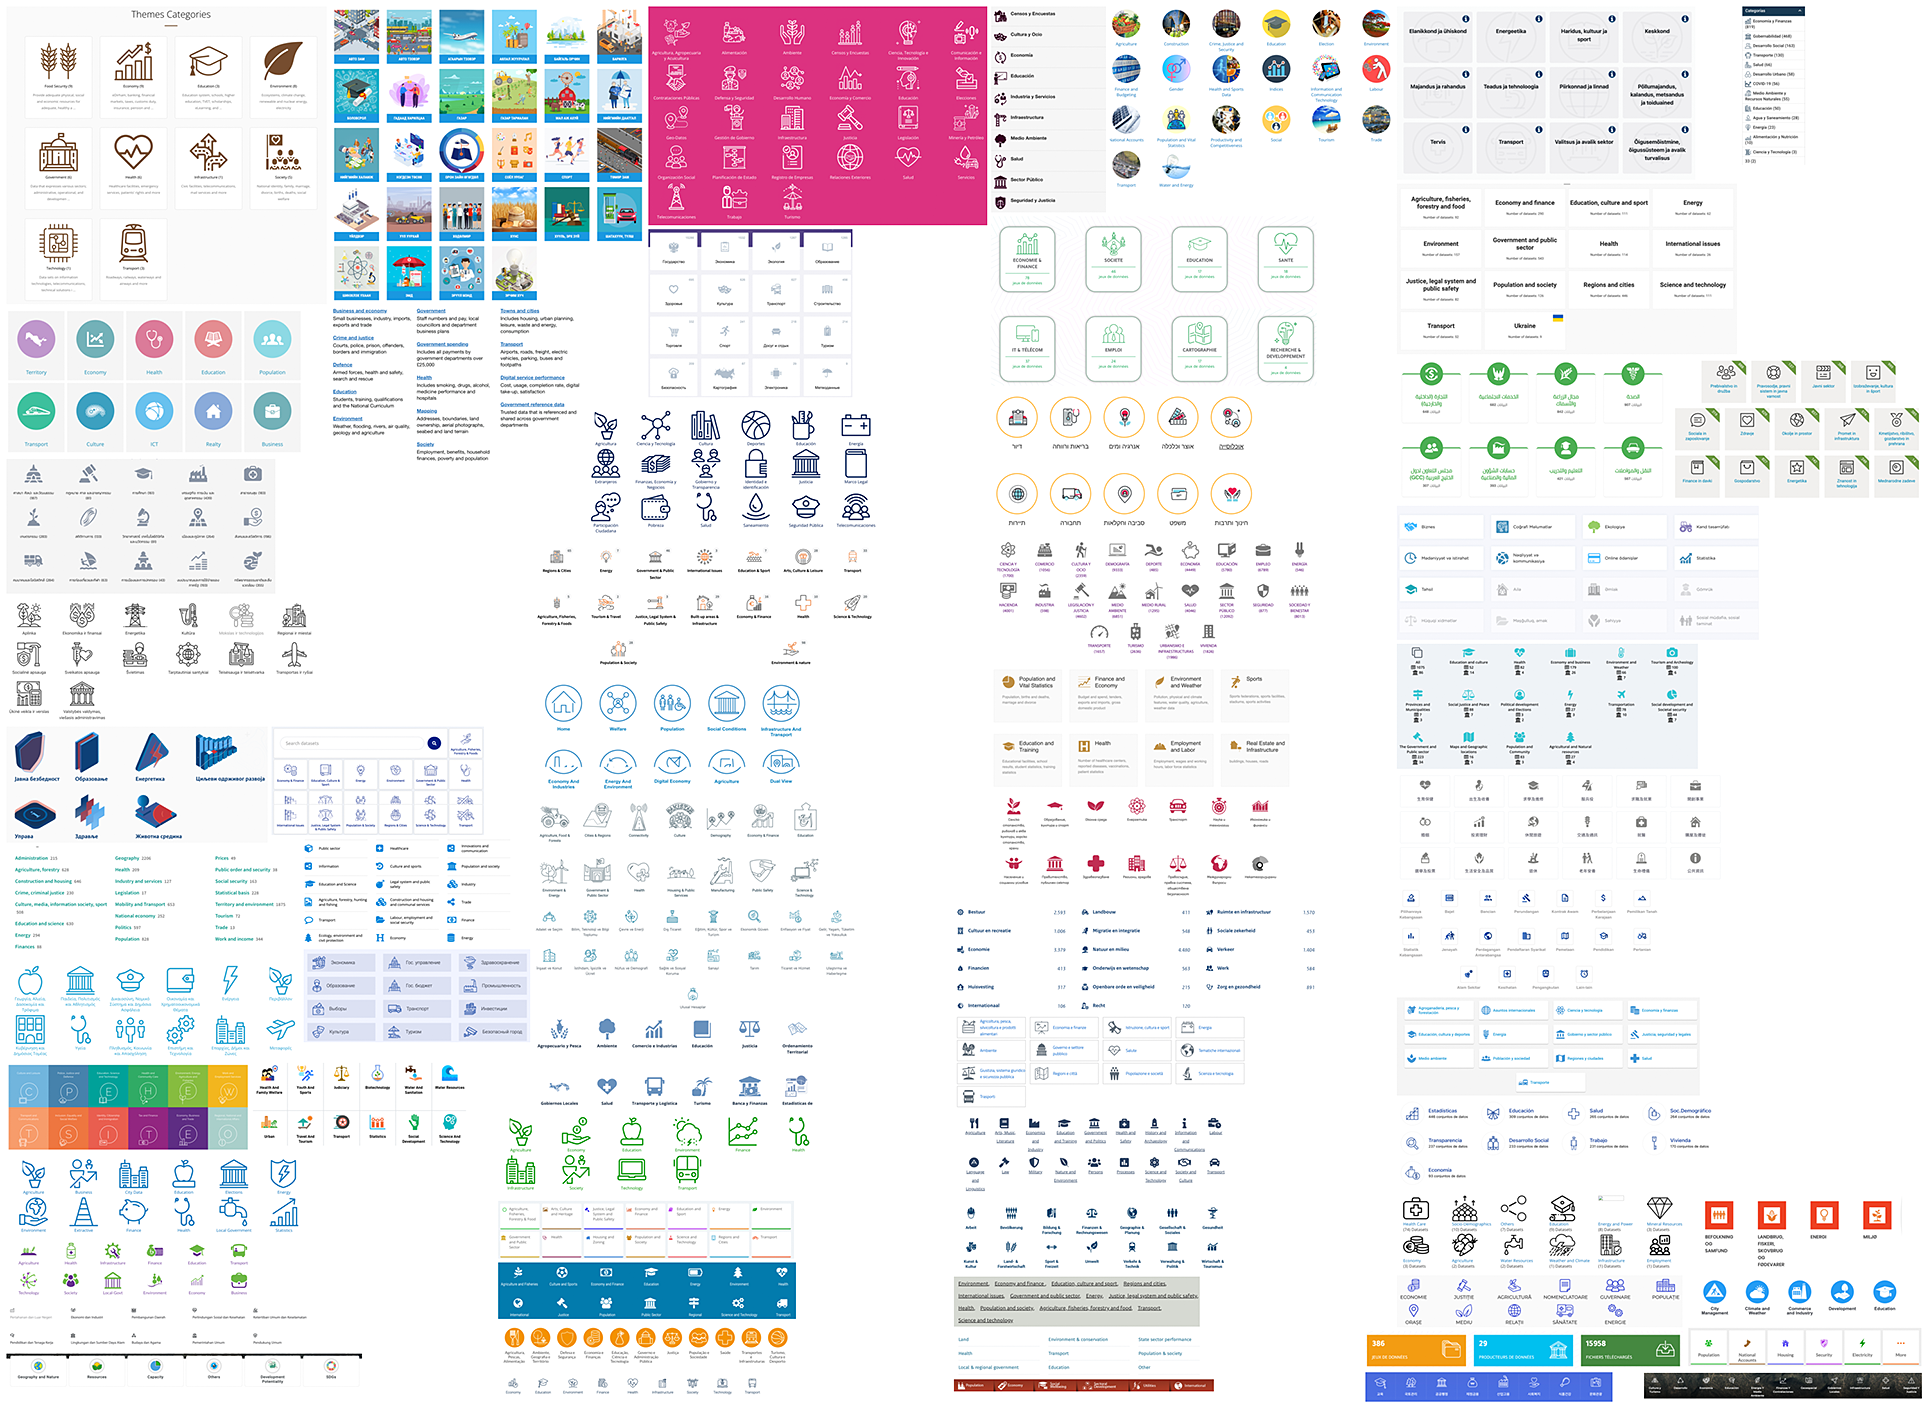
Figure 6. Selection of data topics from national data portal interfaces.
As well as being read against longer histories and aesthetics of the informational and informational graphics the interfaces evoke core elements of graphical user environments, operating systems and apps––with iconography serving as topical interfaces to data collections. The topicalization of data also discloses the curatorial role of portal-makers in displaying official “aspirational ontologies” (Marres, Reference Marres2012) of collective life and collective concern. At first, these may be read as areas where data is most widely available, as an indicator of datafication––but it appears that for many portals these front page topics do not necessarily correspond directly with the topics or categories of data most prevalent amongst published datasets.Footnote 23 This is most evident in the case of empty data topics: topics with no datasets associated with them––such as the Mongolian open data portal’s thematic placeholders for “tourism,” “environment” and “foreign relations,” each with “0 data components” at the time of writing. Perhaps they should rather be taken as “official accounts of reality” (Rogers, Reference Rogers2004), an indication of topics deemed to be of broader societal interest by governments and data portal designers, presented as an invitation to explore key areas of collective life as accounted for through the state and public institutions. Data portals serve as graphical user interfaces (GUIs) between data publishers and data publics and data users, with curated data topics serving as designated entry-points to informational resources of the state.
Another prominent feature of data portal interfaces is usage stats related to data portal activity such as total datasets, APIs, downloads, site visitors, downloads, discussion thread numbers, counts of contributing bodies, and numbers of blog posts, apps, visualizations and data requests (Figure 7). While there are also statistics pertaining to the life of the countries and regions that the portals contain data about––sometimes reminiscent of “at a glance” style summaries, dashboards, and country profiles that may be found on web pages of international organizations and the CIA World Fact Book––portal stats focus on the quantification and display of how data is made public. As historical and social studies of quantification explore the making of official numbers (Desrosières, Reference Desrosières and Naish2002; Espeland and Stevens, Reference Espeland and Stevens2008; Bruno et al., Reference Bruno, Jany-Catrice and Touchelay2016), portal stats may be understood as the making public or socialization of official numbers, displaying what is entailed in publishing data, indicators of success, traces of the work of cajoling government departments, cleaning and uploading datasets, publicizing portals, engaging with users, making applications, organizing events, and so on. Evident in these displays is the sense in which portal users may be those interested in statistical summaries of the work of opening things up––which may also include government departments, other countries, international organizations, funders, NGOs, civil society groups, and other professional users.
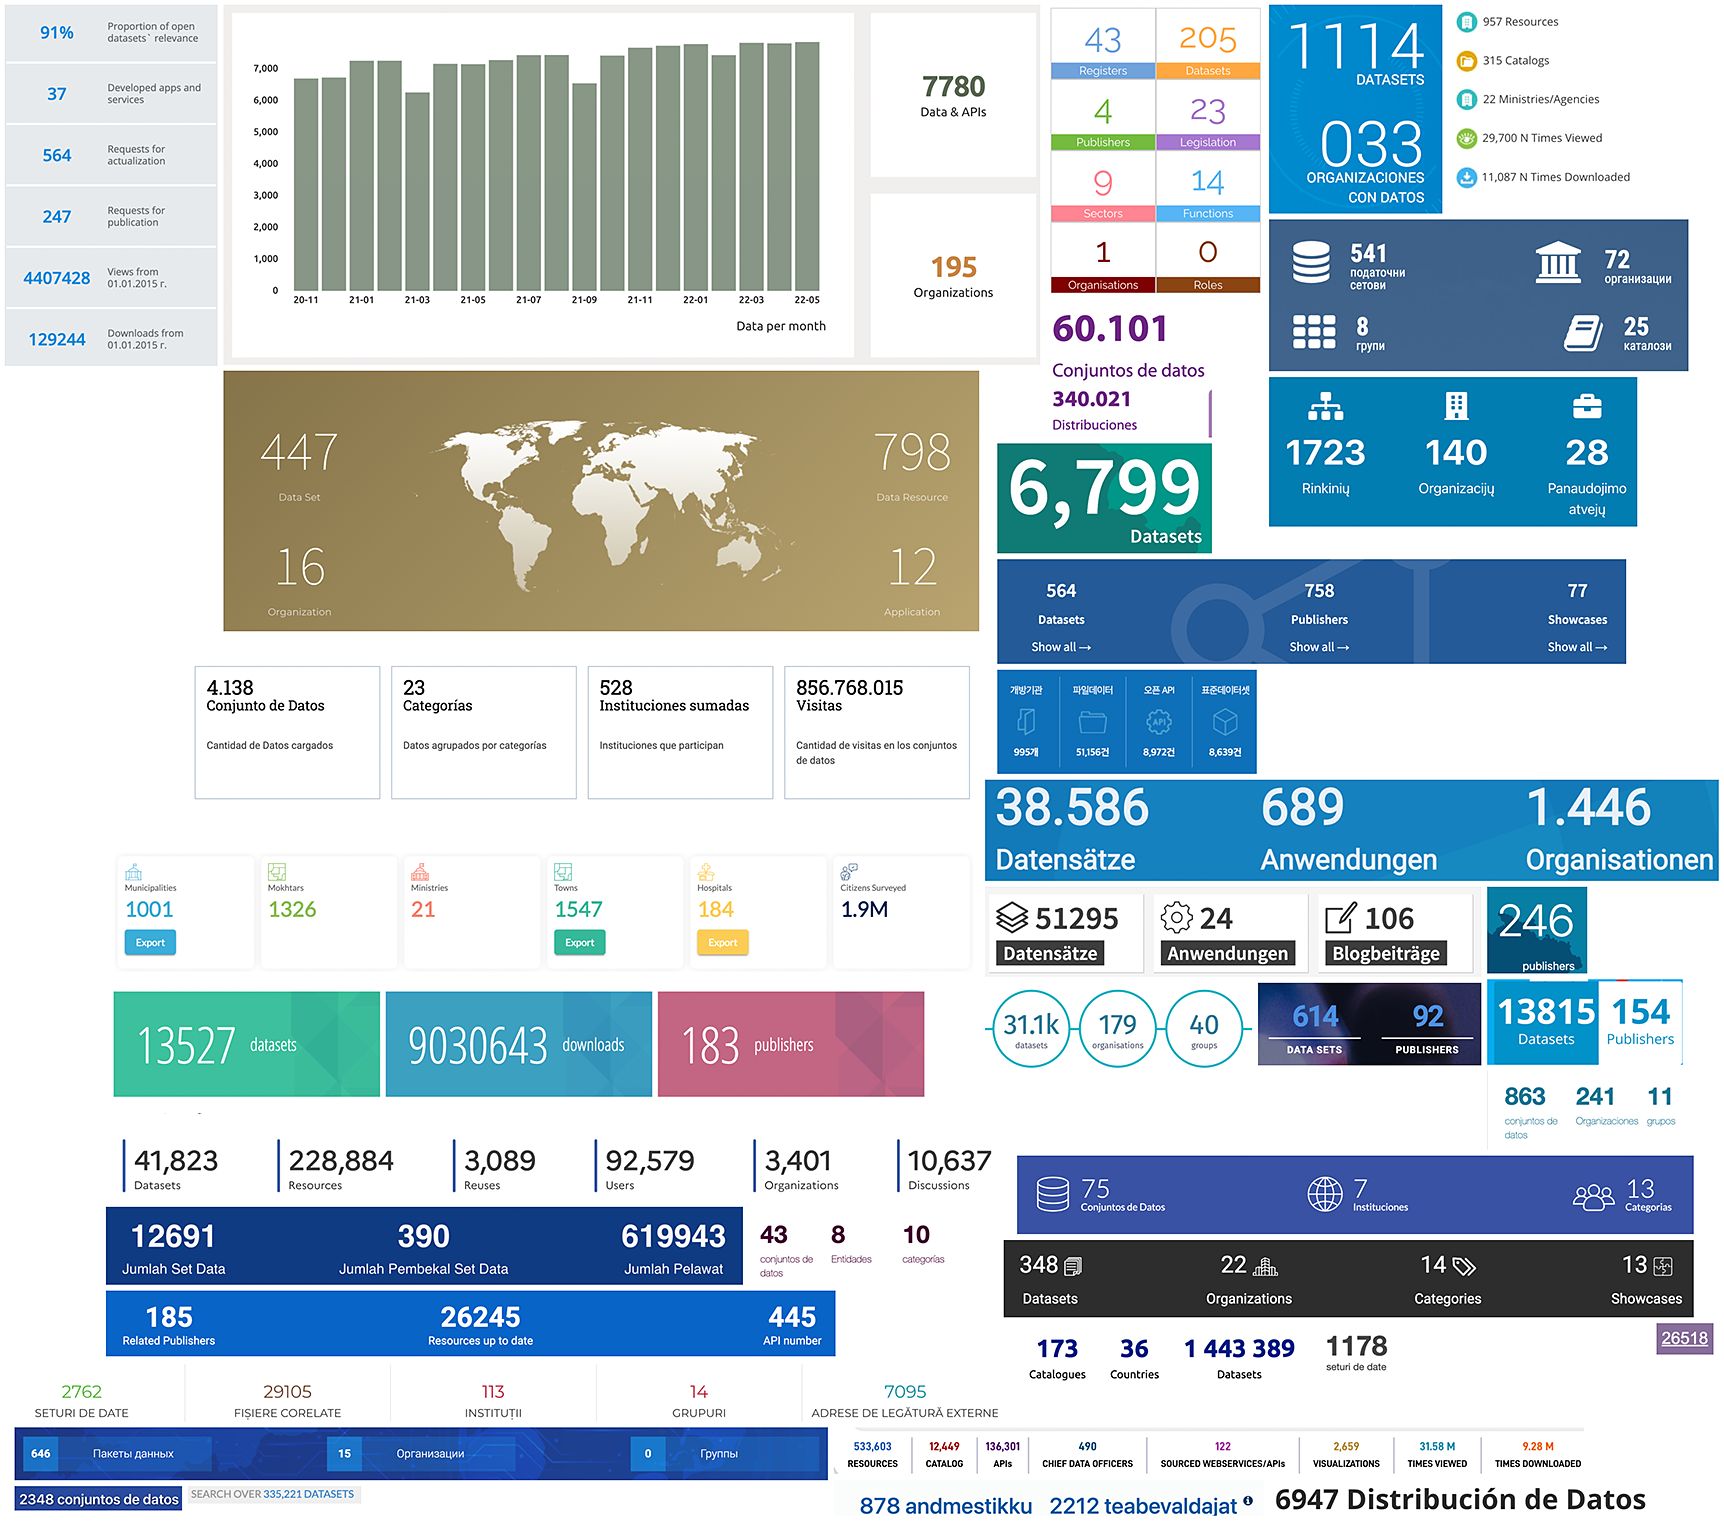
Figure 7. Selection of activity stats from national data portals.
There are also various kinds of showcases with featured apps, app catalogs, app galleries, re-use stories, case studies, re-use studies, impact stories, and other kinds of content related to how data has been re-used. These sometimes mimic the interfaces of app stores such as Apple’s app store and Google’s play store, such Data.gov.uk’s “latest apps” section, positioning data portals as a kind of digital infrastructure upon which innovators and entrepreneurs make things with data, perhaps in the spirit of Tim O’Reilly’s “government as a platform” (O’Reilly, Reference O’Reilly2010; Morozov, Reference Morozov2013). Data.gouv.fr contains a “Réutilizations” (re-uses) section, with over 3000 examples of how French open data has been used, browsable by topic, with each re-use case listing the datasets which were used, metadata, brief descriptions, and images and buttons inviting users to add further re-use cases, contact re-users, contribute to public discussion threads about the case, or embed or link to the project. The EU’s data portal data.europa.eu contains use cases that can be filtered by region and sector, linking to brief case studies for each project, as well as over 400 “studies” on data re-use best practices, impacts, value estimates, event reports, roadmaps and “community reports.”Footnote 24 Some portals such as Bangladesh’s indicate activity by showing popular searches and datasets.Footnote 25
Invitations to make with data also explicitly address developers, including through dedicated pages and spaces for developers (e.g., in portals from Bahrain, Japan, and Singapore). Many portals include APIs or application programming interfaces for both the data portals (e.g., to program requests to portals) as well as for particular datasets (e.g., “real-time APIs” for bus departures and arrivals, rainfall, river levels, air pollution). Some portals offer SPARQL endpoints (e.g., data.europa.eu) to facilitate machines to retrieve linked data. Hence invitations to make with data are not just to take data files as bundles of facts, but also to connect machines with information infrastructures which are part of the official organization of things. Data portals are not only “human-machine interfaces” (Suchman, Reference Suchman2007) but also machine–machine interfaces, inviting involvement from “non-human Users” (Bratton, Reference Bratton2016).
3.2. Software analysis
The study of data portal software offers a complementary perspective on processes of making data public. Software codebases may serve to indicate the conceptual, logistical, and organizational work that goes into infrastructuring public data, including through software extensions that serve to adjust and extend code to suit the settings of deployment, such as to support metadata alignment, translation, customization, interoperability and support for specific data types or file formats. Data portals also embody different kinds of logistical aspirations, from making data “programmable” (Helmond, Reference Helmond2015), to command-line based packaging, to producing read-write “ecologies” and “ecosystems” of public data. Comparisons of different combinations of extensions may suggest different styles of configuration. The exploration of “platformized coding” on GitHub (Bounegru, Reference Bounegru2019) provides a behind-the-scenes look at the various forms of collaboration and transnational coordination involved in adapting data portal software, as well as the organization of infrastructural work, maintenance, and care involved in making data public.
The CKAN codebase on Github gives a sense of how the project has developed from 2007 to the present, with over 23,000 commits from over 390 named users (Figure 8).Footnote 26
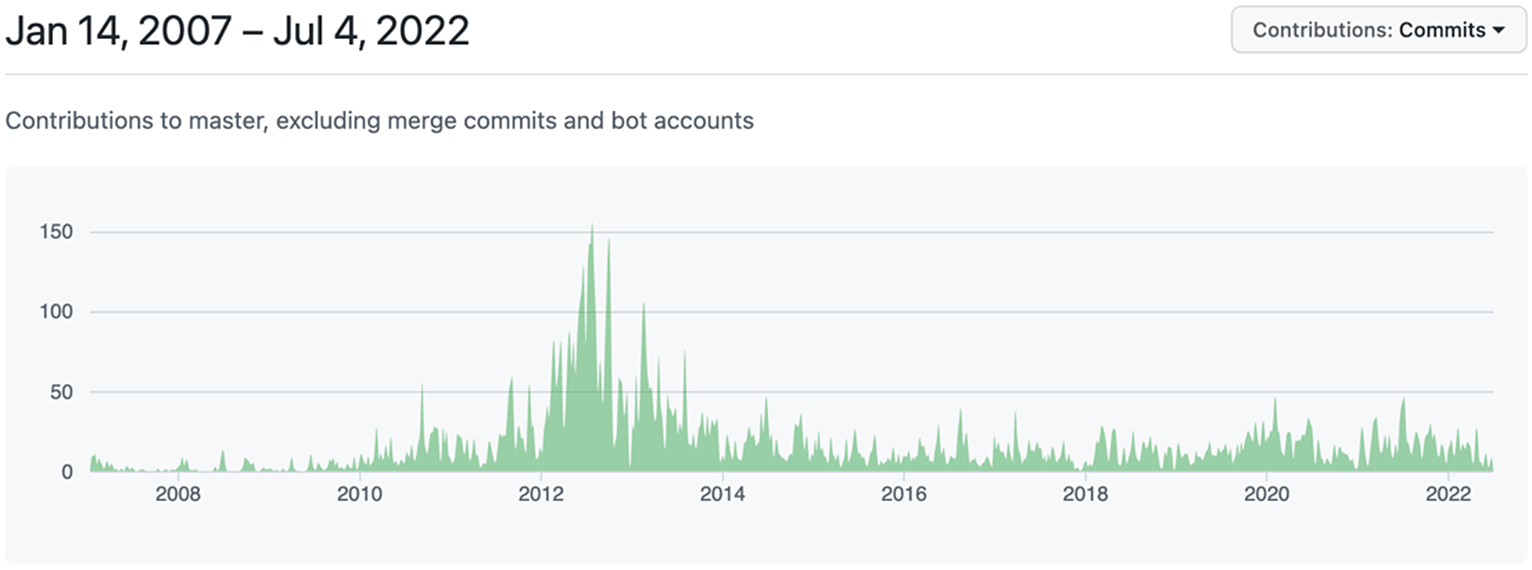
Figure 8. GitHub contributor graph for ckan/ckan repository (2007–2022).
In 2007 the project is described as a “web application to manage listings of knowledge packages,” modeled on software registries.Footnote 27 By 2011 it is described as “opensource data hub and data portal software.”Footnote 28 What is initially set up as a project to support collaborative knowledge development and described as a cross between a wiki, listing, and software package index is translated and adapted to support the publication of open government data. While earlier versions present a more open-ended and social webby domain model of “users,” “packages,” “tags” and “groups,” later versions suggest a more data-focused and professionalized model of “datasets,” “resources,” “organizations,” “authorization,” and controlled “tag vocabularies.” CKAN developers said that the project had to negotiate between this earlier vision of collaborative knowledge development and the needs and requirements of governments using the project.Footnote 29 Some government users did not have close contact with the main CKAN project development team and used the code independently. On the project mailing list one US government developer asked: “Is there a reason that forking is so pervasive in the CKAN community?.” The project has over 1800 forks on GitHub––not counting many other forks and working copies of the code base hosted outside of the platform. One way the project team sought to coordinate different the needs of different users and keeping a shared code base was to enable a CKAN “core” code base and an “ecosystem” of themes and extensions.
The translation and adaptation of CKAN code can be detected in data.gov.uk’s GitHub account, indicating different kinds of work involved in opening up official data––such as customizing a copy of the CKAN code base, harmonizing and exchanging metadata, enabling data schemas, optimizing search services, letting users browse and preview data, scheduling, and testing (Figure 9). Repository activity tells us about the temporality of portal software development. A flurry of new repositories are present in 2016–2017 as the portal is simplified (corresponding with the interface analysis above), after which new repository creation slows down as development settles and stabilizes––and the “perpetual beta” appears somewhat less lively.
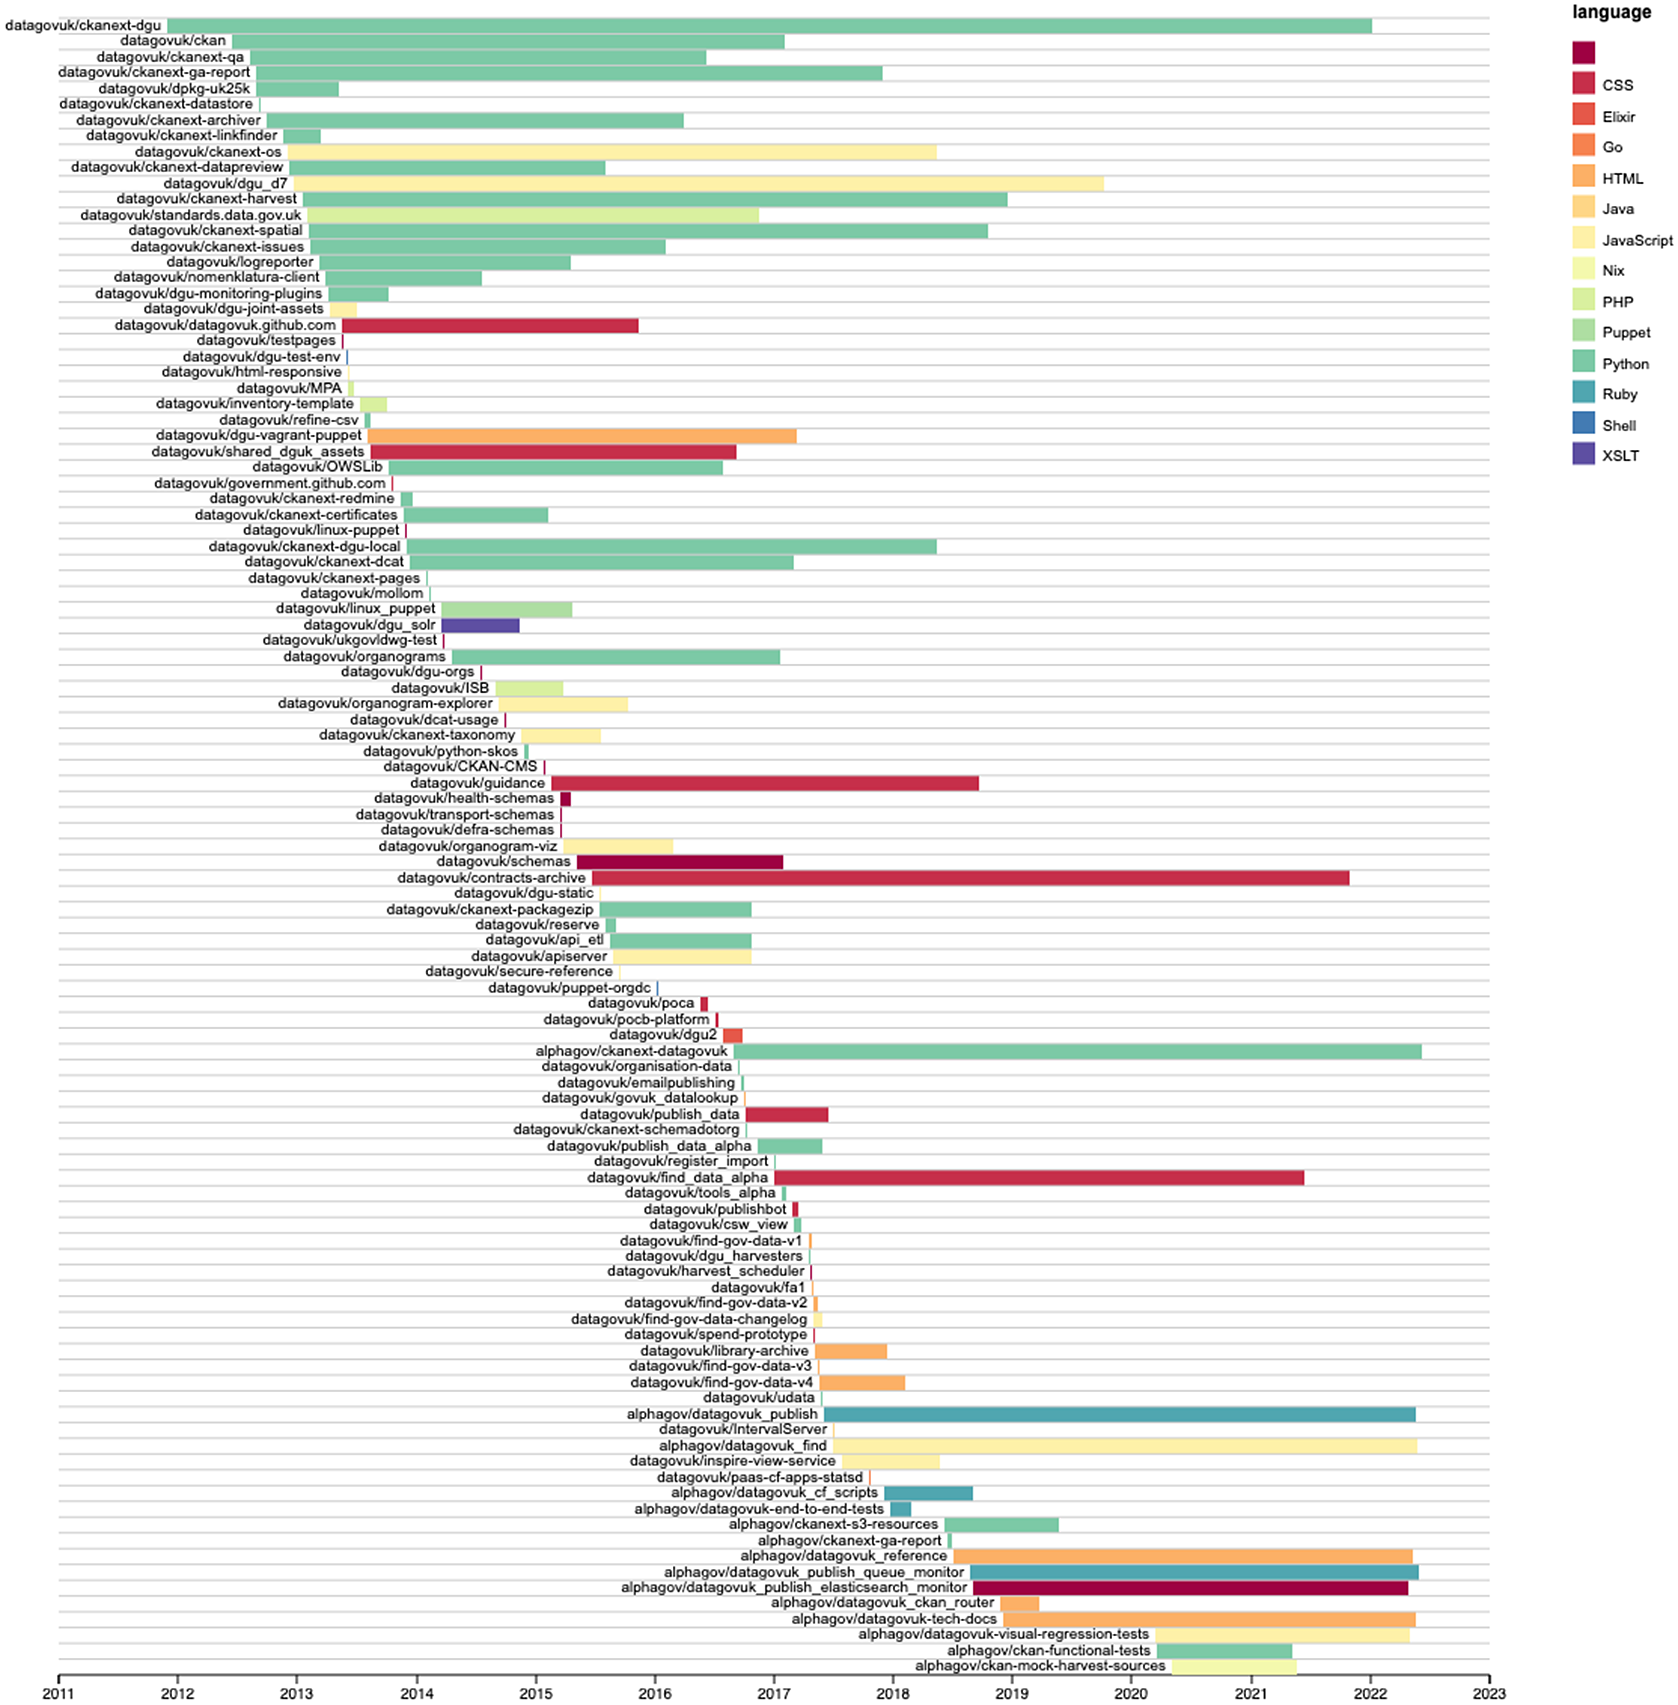
Figure 9. Github repositories associated with Data.gov.uk (2011–2022).
Not all data portals have public GitHub repositories, and not all portal code repositories are actively used. For data portals using the CKAN software and with the API enabled, one can obtain details of the software version and extensions enabled. Taking a selection of data portals around the world using the CKAN software and their extensions as listed through the API provides a complementary perspective on data portal configuration (Figure 10).
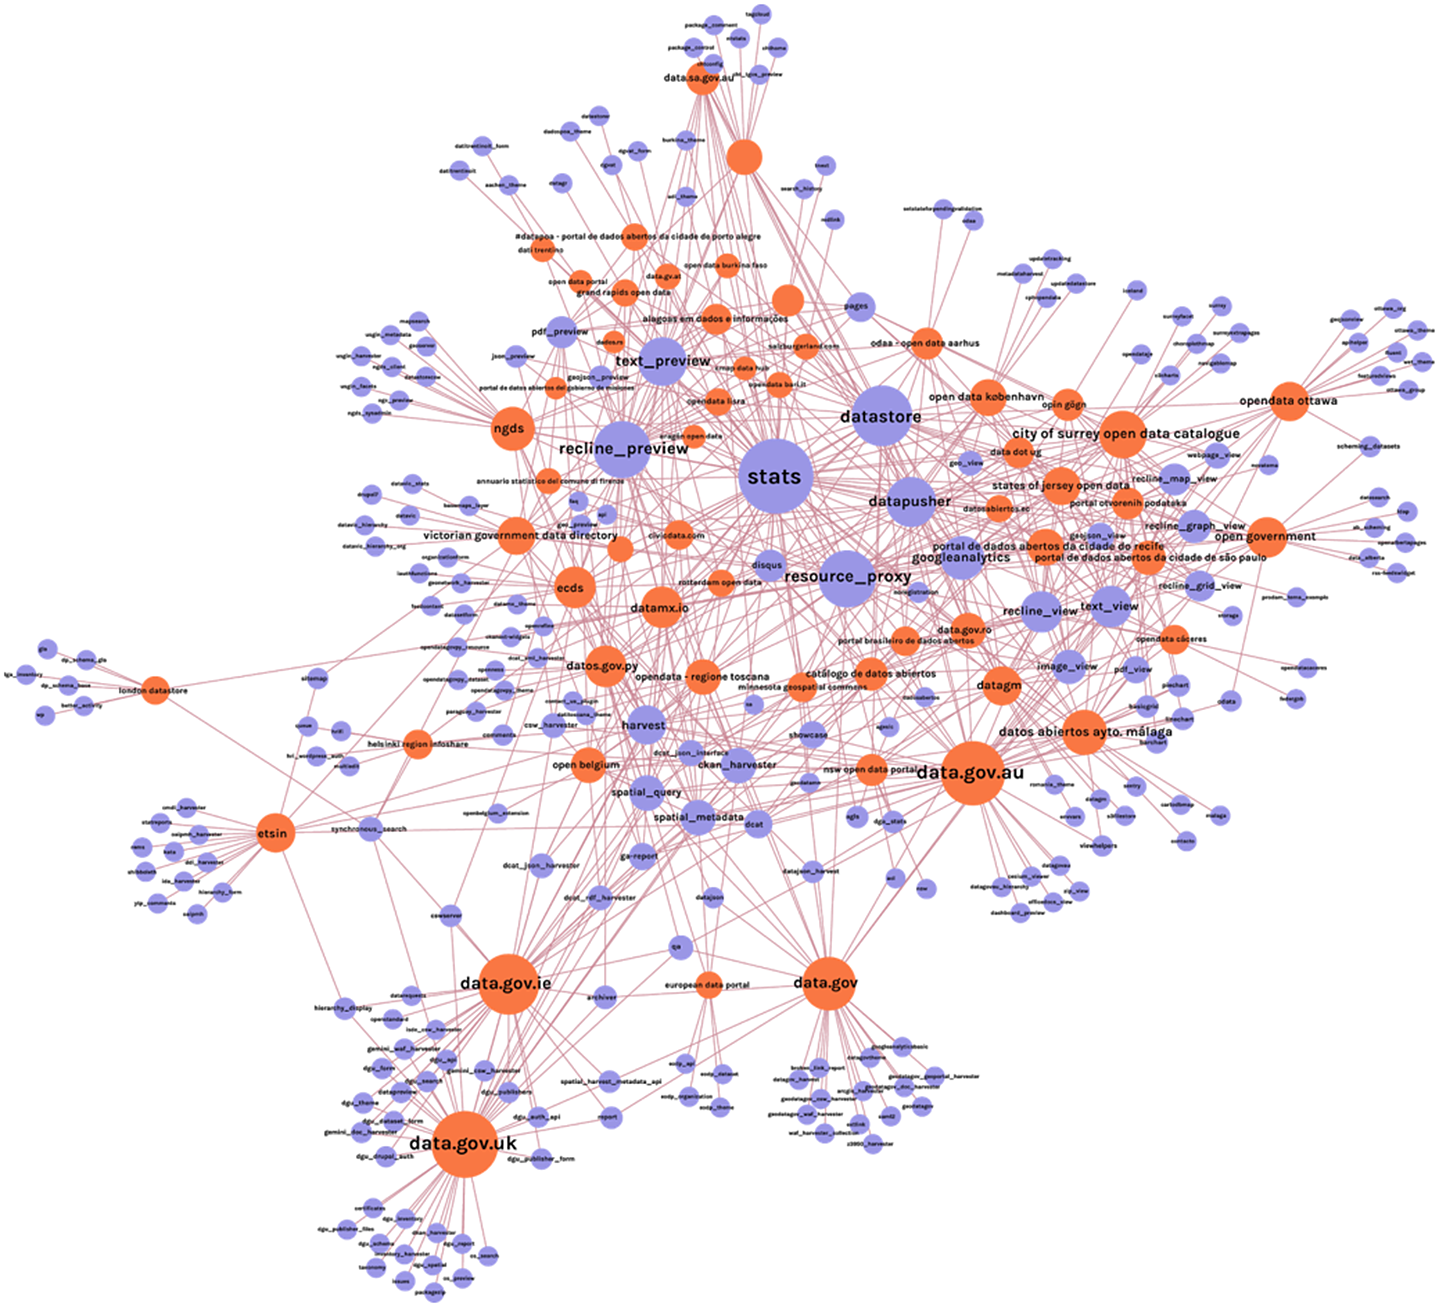
Figure 10. Bi-partite network graph showing data portals (red) and the extensions that they share (blue). Created at Digital Methods Winter School 2017 using the Gephi software and spatialized using the Force Atlas 2 graph layout algorithm.Footnote 30
In the graph, one can see which extensions are most commonly shared in the center (e.g., “stats” and “datastore”) as well as portals that have more unique extensions and customizations which are not shared by other portals towards the edges (notably data.gov and data.gov.uk towards the bottom of the graph). Some clusters of extensions are associated with similar kinds of functionalities, such as metadata harvesting and exchange (lower center, around “harvest”) and data and document previewing (top left, around “text preview”). These may be taken as an indication of convergence and variations in data portal software configuration.
Data portal software indicates the scripting of various relations, entities, actions, operations, and activities involved in making data public. In the case of data portals using CKAN software one can observe the transition from a service modeled on a free/open-source software package manager to an extensible and customizable Wordpress-like “data management system” for government data publication with support for different aspects of behind-the-scenes data work involved in making informational materials into a re-usable resource.
3.3. Metadata analysis
Data portal metadata has been widely used as the basis for reports on the effectiveness of data portals and open data initiatives. Some researchers assess metadata quality (Neumaier et al., Reference Neumaier, Umbrich and Polleres2016; Nogueras-Iso et al., Reference Nogueras-Iso, Lacasta, Ureña-Cámara and Ariza-López2021). Data.europa.eu provides metadata quality pages including ratings of “findability,” “accessibility,” “interoperability,” “reusability” and “contextuality,” building on elements of the Data Catalog Vocabulary (DCAT) standard.Footnote 31 As seen in the previous section, data portal software often supports data publishers to create, modify and work with metadata about government datasets. Data portals often don’t store datasets directly, but link to external pages or sites where data may be downloaded––which has the implication that data portals may focus more on metadata curation and linking than on dataset publication per se. If data portals are aggregation mechanisms, then metadata can tell us both about the resources which are aggregated, as well as processes and activities involved in gathering and making data public.
What kinds of metadata do data portals provide and how can this be used to study them as online devices? The DCAT vocabulary aims to “facilitate interoperability between data catalogs published on the Web” through providing a model for data portal metadata––including for catalogs, datasets, data services, resources, publishers, and relations between them (Figure 11).
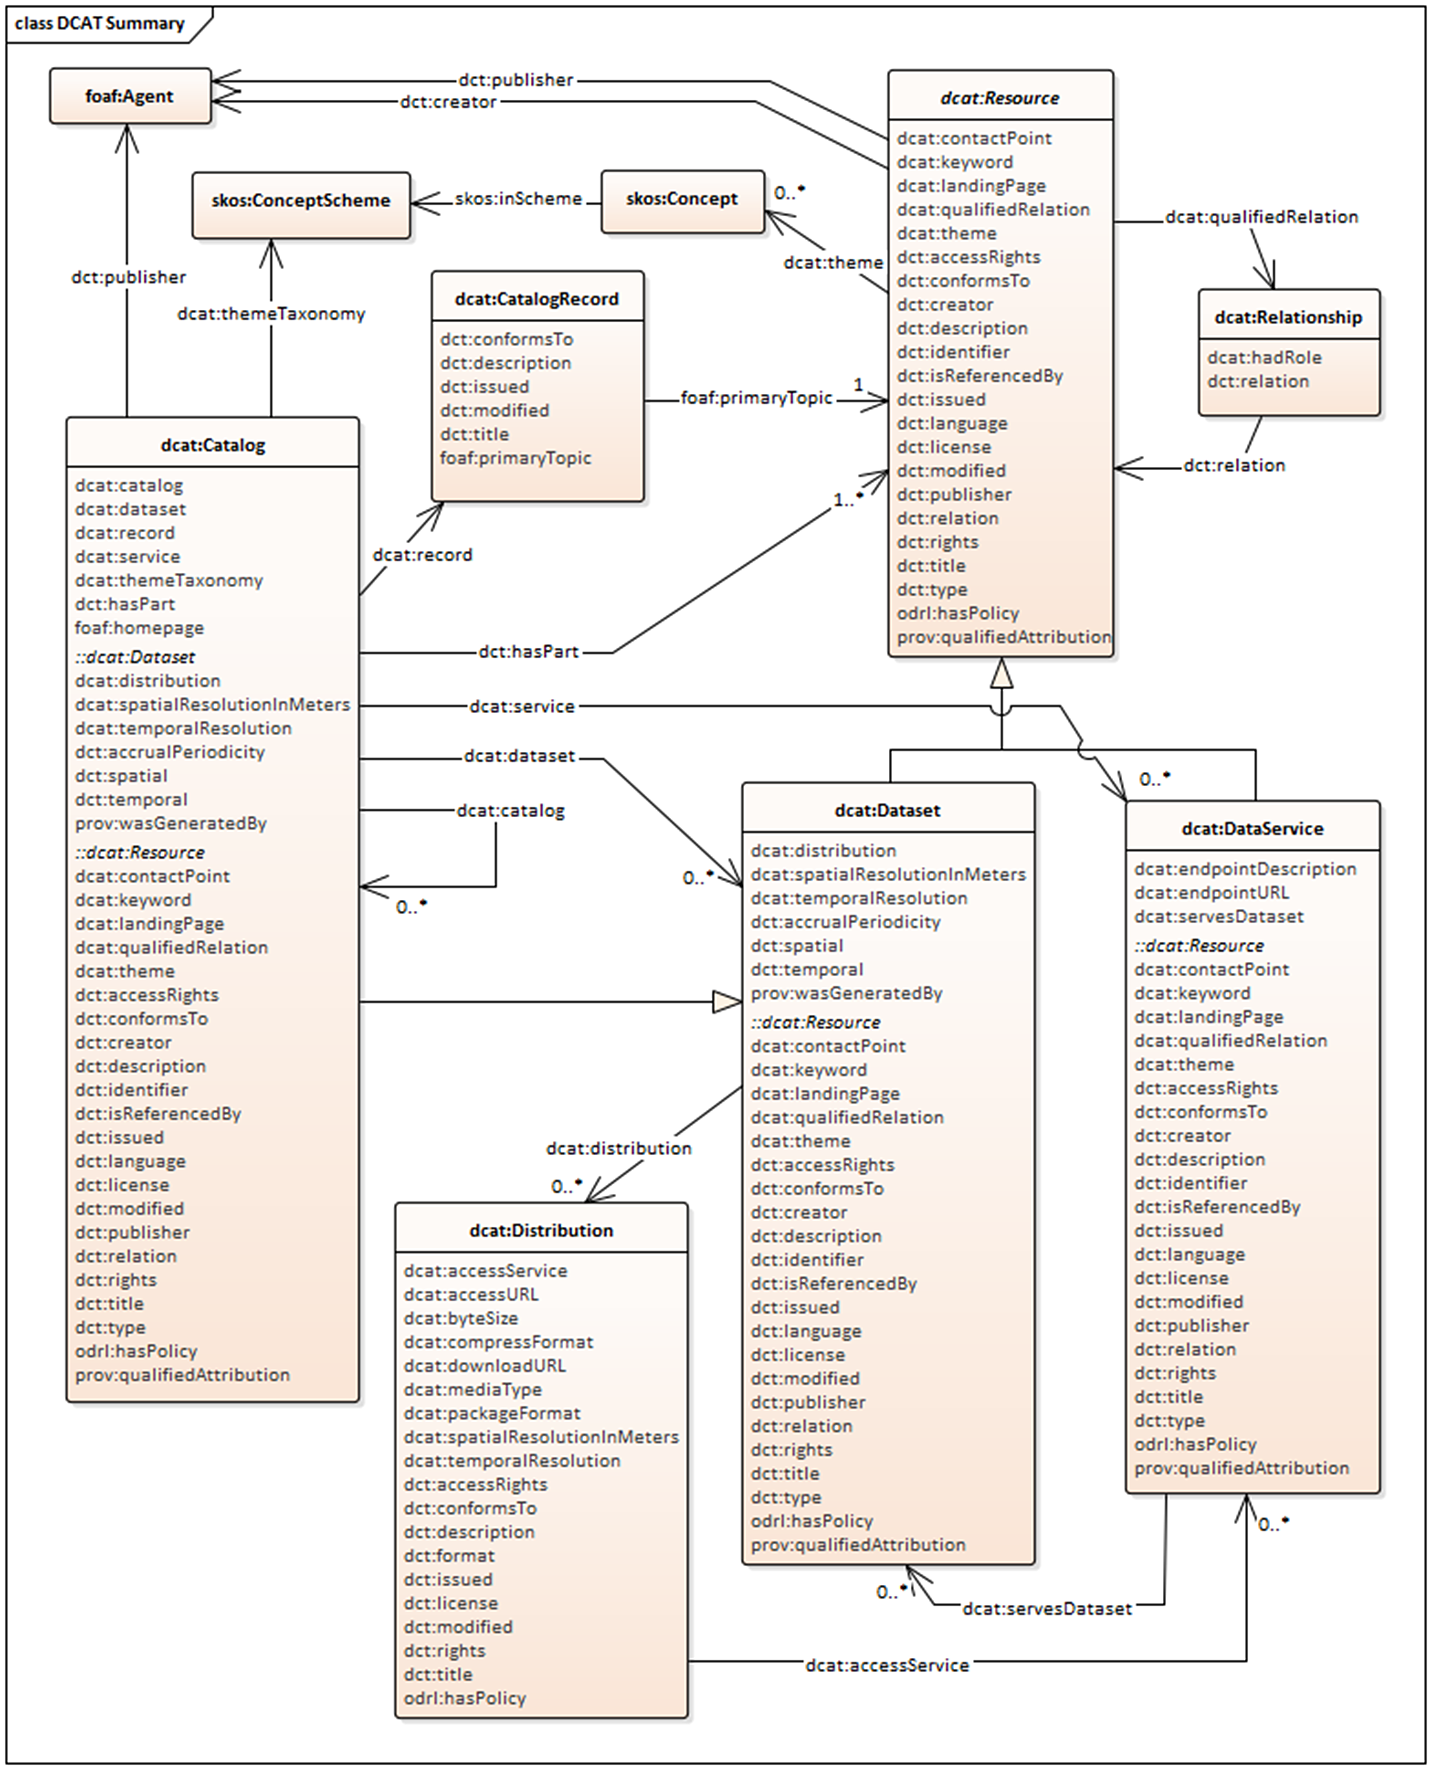
Figure 11. Diagram showing DCAT 2 metadata model, W3C.Footnote 32
The Data Portal Explorer tool was created in order to gather and work with metadata from data portals, with an initial focus on those running on CKAN.Footnote 33 As per its original vision based on software package management, CKAN was designed not only for human data users, but also to enable machines to gather and work with datasets and associated metadata. Data portals thus facilitate the programmability of public data, whether for individual data users or for interoperability with online services, apps, and platforms.
Informed by work on the histories and sociologies of quantification (Desrosières, Reference Desrosières and Naish2002; Espeland and Stevens, Reference Espeland and Stevens2008; Bruno et al., Reference Bruno, Jany-Catrice and Touchelay2016) analyzing data about datasets may provide both historical and comparative insights into the politics of public sector datafication: which kinds of topics and concerns appear when, how they are “parameterized” (Gray, Reference Gray2018b), and which receive attention from data portal makers and users. For example, looking at metadata on topics and organizations on data.gov.uk (Figure 12), one can see many datasets related to environment and mapping from a handful of organizations who appear to contribute the greatest numbers of datasets (e.g., United Kingdom Hydrographic Office, Natural England, Environment Agency) ––while also seeing that government spending data has the greatest number and diversity of different organizational contributors by topics, reflecting the liberal-conservative coalition government’s spending transparency commitments (Gray, Reference Gray2014). The data that ends up on data portals is a mix of what is most widely available, and what has been politically prioritized.
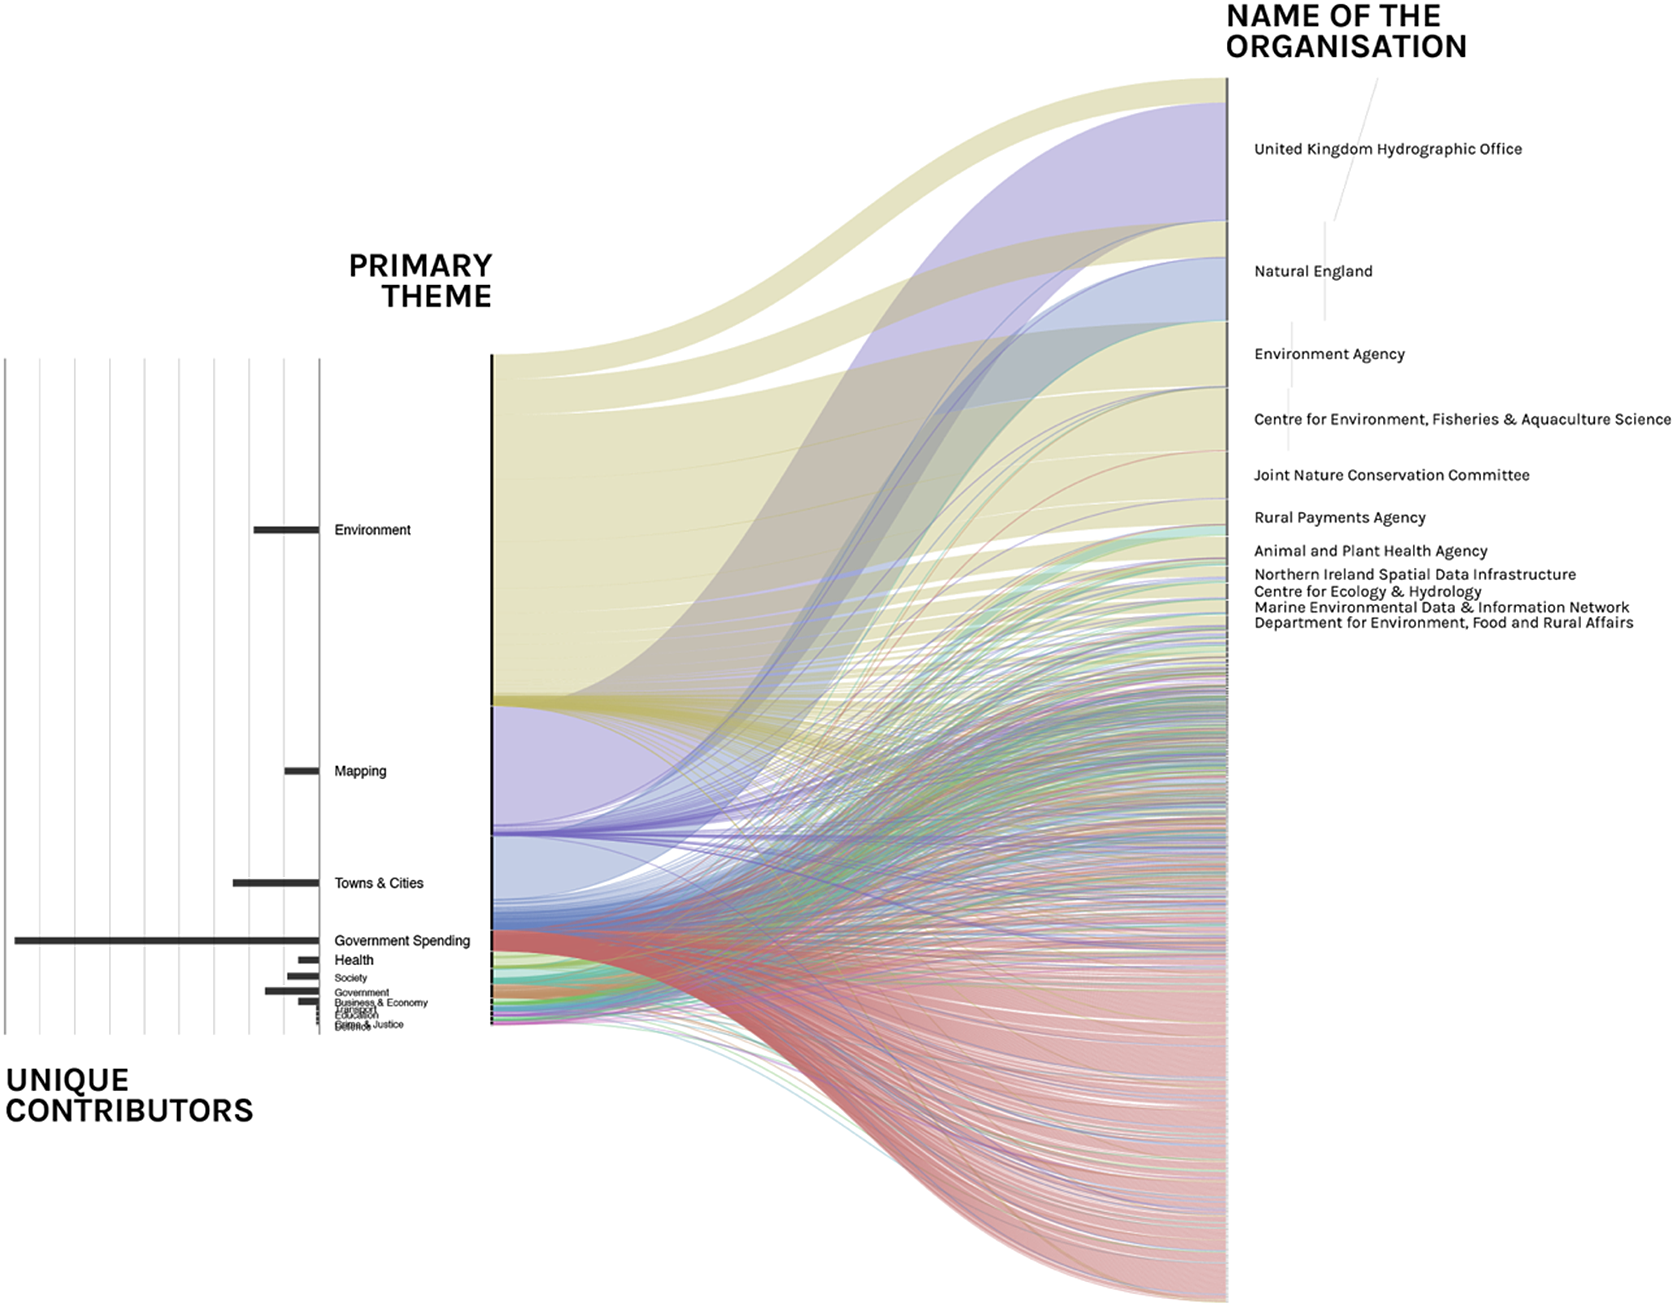
Figure 12. Alluvial chart showing relation between number of datasets added to Data.gov.uk by data “themes” or topics (left) and public sector entities (right), created at Digital Methods Winter School in Amsterdam, January 2017.
As well as broader data topics, datasets can also be tagged with more granular and specific tags. One can observe tags related to particular data collection methods (“census-2016” on data.gov.ie, “in-situ-laboratory-instruments-profilers-sounders-acoustic-sounders” on data.gov) ––as well as places (“Hawaii,” “Canada,” “Europe”), and many different kinds of entities and concerns (“mammal,” “school,” “ocean,” “ships,” “tree rings,” “wildlife,” “reef,” “borehole,” “webcam,” “oil spill,” “day patient,” “earnings,” “lithosphere,” “bus,” “prison,” “milk,” “woodland,” “carbon,” “floods,” “death”). Data portal tags indicate how the byproducts of quantification and data collection involved in coordinating and managing collective life are labelled and presented for broader public consumption. In complement to studies looking at broader semantic patterns in metadata (Adel Rezk et al., Reference Adel Rezk, Ojo, Hassan, Camarinha-Matos, Afsarmanesh and Fornasiero2017), there is also perhaps a case to be made for reading these specific kinds of granular traces alongside institutional histories and arrangements for making things legible and intelligible in particular ways (Gray, Reference Gray2018b).
Data portal metadata can also provide insights into how data is being put to work by different actors. For example, metadata from data.gov.uk’s app catalog can be repurposed in order to explore relations between tags and apps, giving us a picture of how public sector data is used to generate different ways of knowing, experiencing and interacting with data (Figure 13). Many of these focus on location-based personalization (e.g., find a doctor, find childcare, find a school) and decision-making and choice (compare care homes, check food and hygiene). Towards the center of the graph are apps that combine different datasets and indicators in order to operationalize notions such as “walkability,” “liveability” and “pleasantness”––suggesting a kind of combinatorial analytic creativity, as well as how data is used for personal environmental optimization.

Figure 13. Bipartite network showing apps and user-generated tags associated with them from Data.gov.uk “app catalog.” Created using the Gephi software, spatialized using the ForceAtlas2 graph layout algorithm (Jacomy et al., Reference Jacomy, Venturini, Heymann and Bastian2014) and annotated through qualitative analysis.
Sometimes data requests and their responses are made public, which enables one to see when they are successful (e.g., when institutions reply with data being requested) and sometimes not (e.g., when data is not generated or when it cannot be published). Data portal mechanisms can facilitate encounters between citizens and public servants, surfacing different understandings and assumptions about what data portals are for, what can be done on them, and what kinds of data one might expect institutions to gather and open up. Whether they are successful or not, requests and suggestions can indicate what data portal visitors come looking for and why, what they hope or expect to find, what is and is not counted as public data, what kinds of information public bodies do and do not collect and make available, and what kinds of questions it is and is not possible to answer with public sector data. Unsuccessful requests include those for data which can be more specific than that generated by institutions (e.g., “accidents with injuries as a result of an activity with a horse in the Netherlands”), with different methods, starting points, coverage or time spans. Data requests probe the limits of what can be made public (e.g., “addresses where a firearm is available”), as well as the limits of what kinds of information institutions routinely and systematically gather as part of their defined tasks (e.g., “list of municipal councillors who have split from their local political party”).
Compiling unsuccessful data requests from across portals surfaces a plethora of interests, concerns, curiosities, and queries for data that does not exist or which is not made public (Figure 14).Footnote 34 Rather than assuming a kind of “data universalism” (Milan and Treré, Reference Milan and Treré2019), these unsuccessful attempts to obtain data through portals highlight some of the different ways in which data comes to matter to different people in different situations. While the United Nations talks of “data gaps,”Footnote 35 how do we establish what is to be considered absent? Mimi Ọnụọha’s “Library of Missing Datasets” draws attention to “things that have been excluded in a society where so much is collected,” and invites us to reflect on what is counted, what is not, and who decides.Footnote 36 In the spirit of feminist STS researcher Susan Leigh Star’s unfolding of relations between “lived experience,” “technologies” and “silences” (Star, Reference Star, Olsen and Selinger2007), what is considered missing data, absent data, a “data gap” or a “data void” can be taken as an open-ended question to be addressed in relational and situational terms.Footnote 37 Data portals may thus serve as an entry-point not only for finding official datasets, but also for the empirical elaboration of missingness and the questions and lines of inquiry which cannot be addressed by current arrangements.
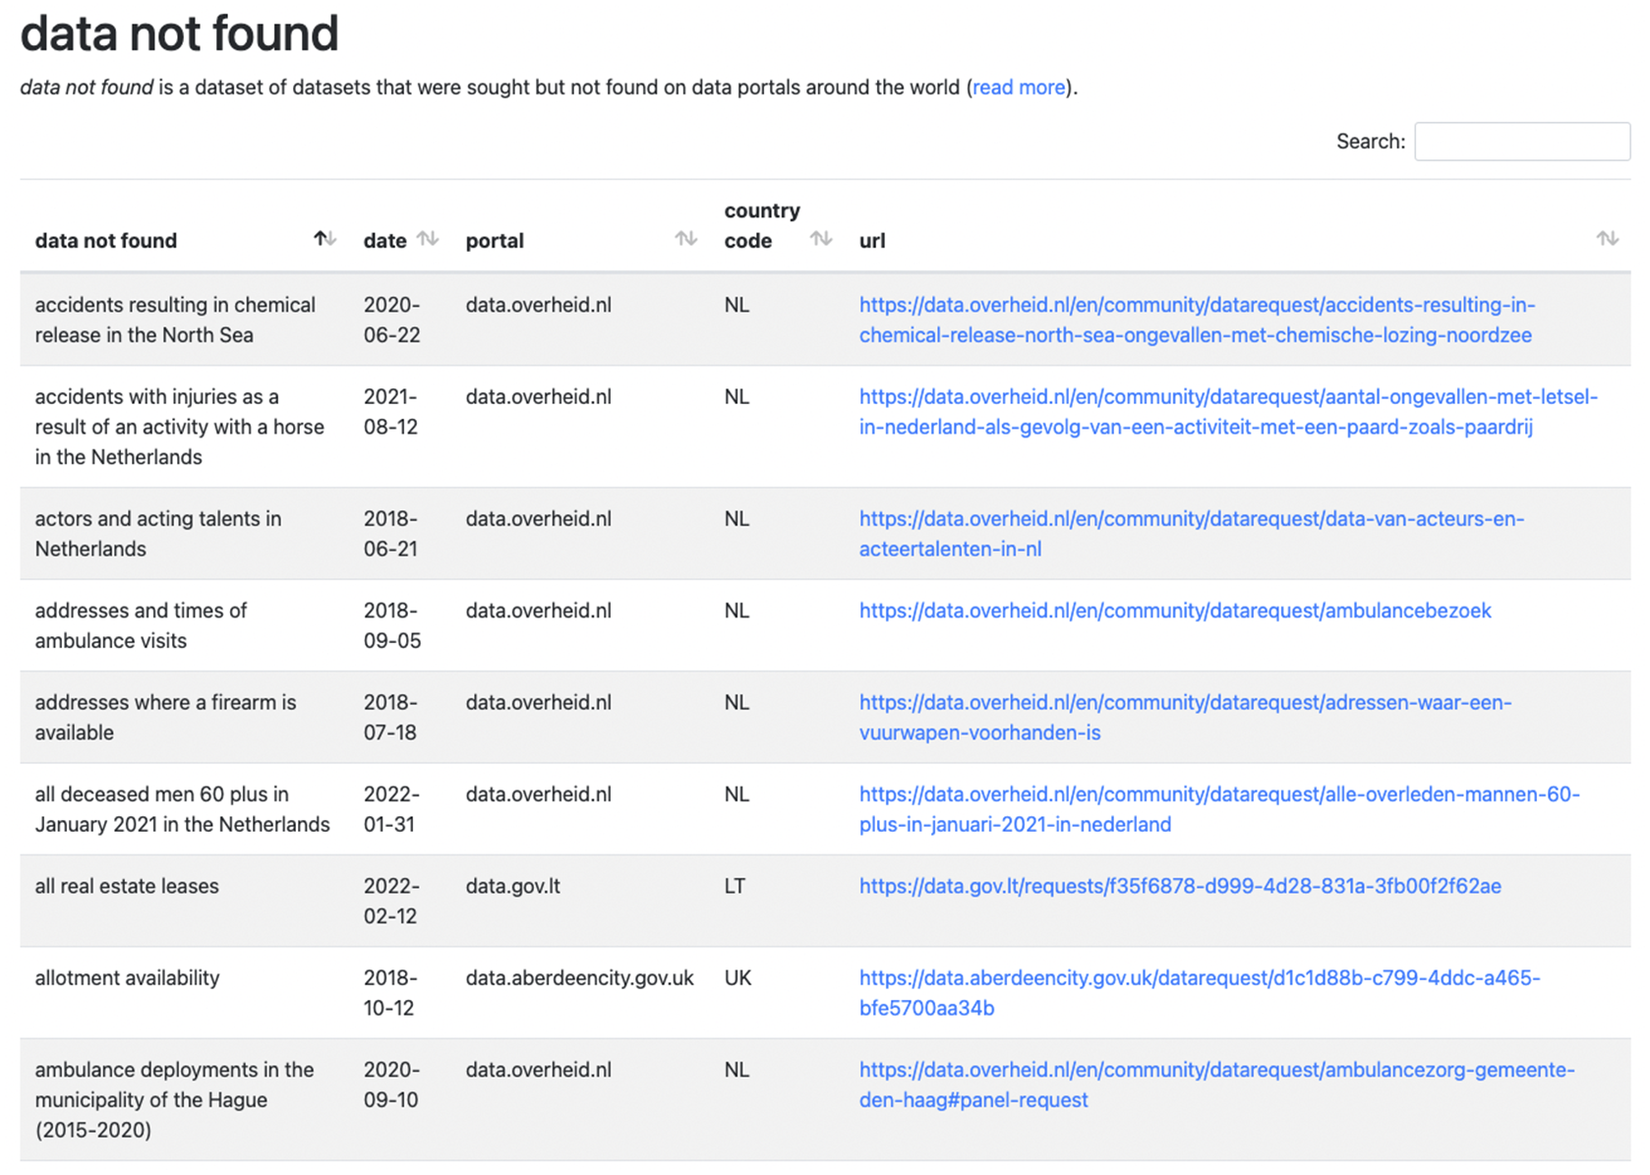
Figure 14. Data not found, a dataset of datasets that were sought but not found on data portals around the world. Available at: http://datanotfound.jwyg.org/.
4. Conclusion
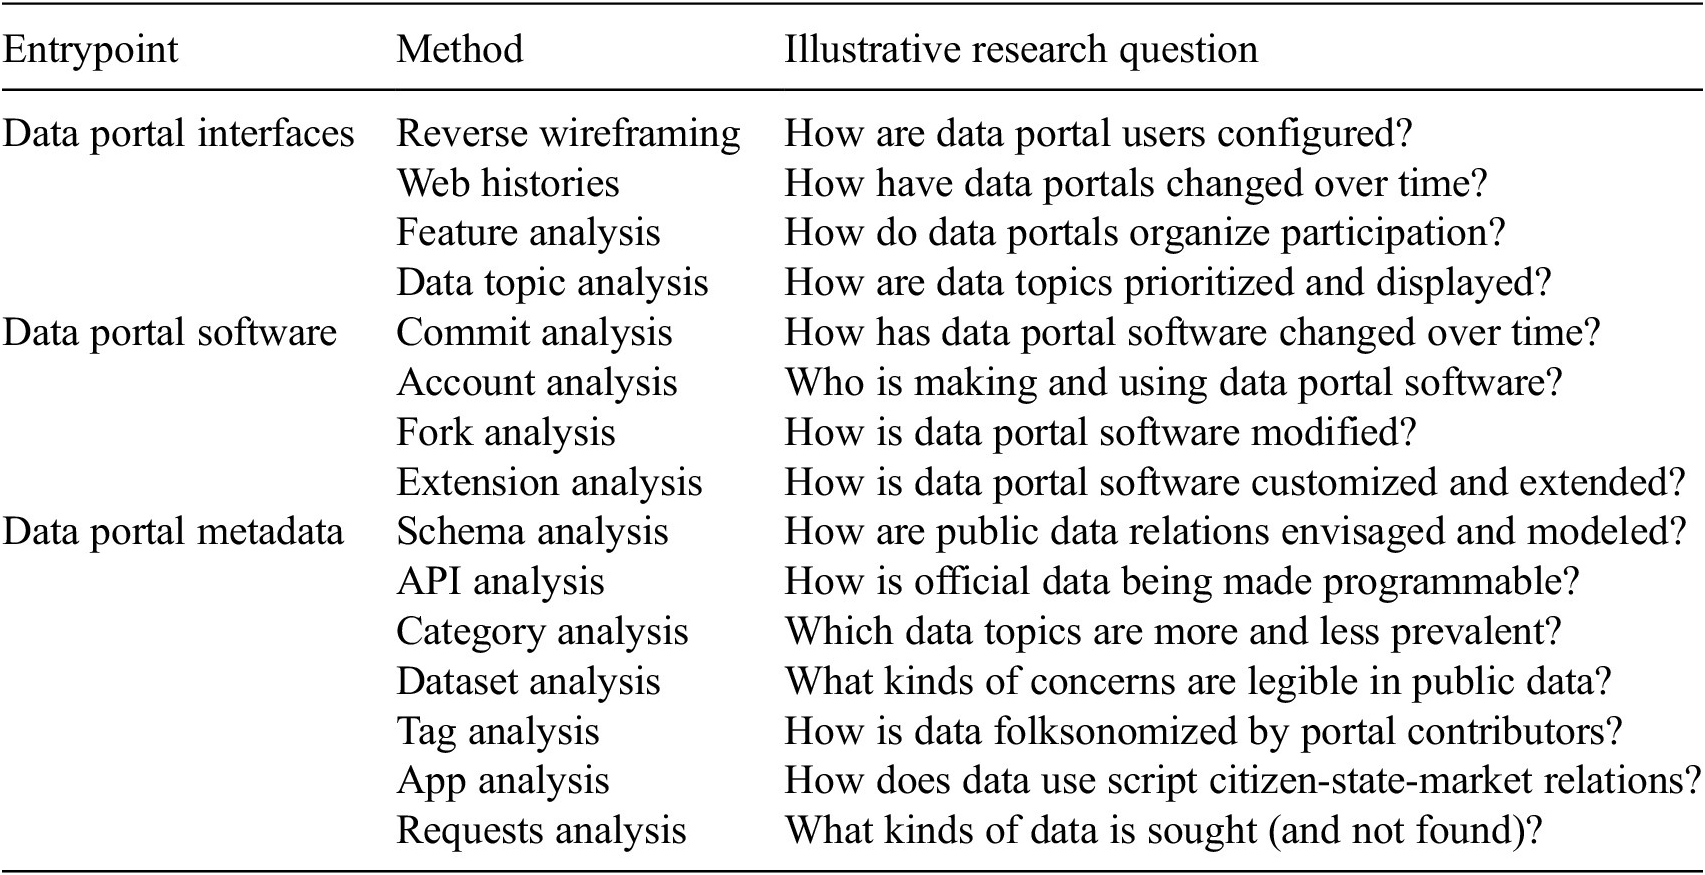
This article explores what research on data portals can draw from device-sensitive research approaches––including to examine what data portals produce, their makers, users, parts, processes, and politics as they render informational resources of public institutions as more widely re-usable digital data. The sections above have outlined and illustrated three approaches to studying data portals as online devices (Table 1): firstly, by attending to data portal interfaces, including reverse wireframing and web histories; second, by examining data portal software, including code repositories and software extensions; and third, by looking at data portal metadata, including domain models as well as metadata on topics, tags, organizations, apps, and data requests.
Table 1. Illustrative analytical scenarios for studying data portals as online devices
As well as supporting the study of individual data portals these approaches may surface conventions, features, and libraries which are shared across multiple portals, whether local, regional, national, or transnational in scope. Taking cue from device-sensitive research, these three approaches can help to surface the various actors, materials, and processes which are involved in operationalizing open government data commitments, as well as associated tensions, frictions, instabilities involved in the “rawification” of public sector information (Denis and Goëta, Reference Denis and Goëta2017).
Data portals are not just technical systems to operationalize pre-existing policy commitments, but socio-technical assemblages which gather heterogenous actors to take part in data-mediated transparency, participation, and innovation. They do many different kinds of things, for many different kinds of actors with many different kinds of objectives. Their material organization can be unpacked and understood as the result of an accumulation of decisions, negotiations, circumstances, and contingencies. The study of portal interfaces, software, and metadata may contribute to relational approaches to the configuration of state institutions in society (Thelen et al., Reference Thelen, Vetters and von Benda-Beckmann2017); research that aims to situate data practices in society (Leurs, Reference Leurs2017; Rettberg, Reference Rettberg2020); as well as “post-instrumental” understandings of how online devices are increasingly equipped with capacities to take part (Marres, Reference Marres2012), rather than just serving as part of the scenery. Attending to data portals as sites of friction (Tsing, Reference Tsing2011), for example, in failed data portal requests; and translation (Callon, Reference Callon1984), for example, as a collaborative knowledge tool is adapted for institutional publishing needs, may contribute to de-instrumentalizing data portals and being alive to their politics, dynamics, social lives and possibilities as online devices. As well as serving to commensurate (Espeland and Stevens, Reference Espeland and Stevens1998) wide-ranging informational resources and publish them as data in a way that is amenable to various forms of quantification (Espeland and Stevens, Reference Espeland and Stevens2008), data portals draw on a range of different practices and action repertoires to make data available, from public-facing features to support searching, browsing, discussion, sharing, and requesting, to institutional mechanisms for gathering and harmonizing metadata, indexing datasets and monitoring activity.
How do these approaches modify understanding of the prospects of data portals? May they be viewed as agents of data colonialism (Couldry and Mejias, Reference Couldry and Mejias2019) or surveillance capitalism (Zuboff, Reference Zuboff2019), extending the platforms and logics of big tech ever more into public institutions, workplaces, and everyday life through a kind of information subsidy to corporates? As part of longer histories of colonialism (Hoyng, Reference Hoyng2021) and economic discipline (Roberts, Reference Roberts2011), involved in both the making of particular kinds of states and state-market-citizen relations, as well as emerging arrangements of planetary scale computation (Bratton, Reference Bratton2016)? For critical data studies (Dalton and Thatcher, Reference Dalton and Thatcher2014; Dalton et al., Reference Dalton, Taylor and Thatcher2016; Iliadis and Russo, Reference Iliadis and Russo2016), attending to the details of portal interfaces, software, and metadata may be used to empirically elaborate how commodification unfolds. This includes assessing how may fail to deliver on their aspirations––for example, by highlighting “missing users” (Heald, Reference Heald2012), limited and non-diverse participation, short-lived projects, regressive redistribution, or how apps and outcomes often serve marketization and commercialization of public data rather than centering issues and under-served communities. Studying data portals as online devices may show how some aims and interests are much better served than others, as well as helping to situate data portals in relation to troubling tendencies and agendas.
Will data portals continue to be created and maintained? And if so, how might they be done differently? For example, could one rethink or remake data portals along the lines of recent work on data feminism (D’Ignazio and Klein, Reference D’Ignazio and Klein2020), critical data practices (Bounegru and Gray, Reference Bounegru and Gray2021) or undoing data-driven optimization (Powell, Reference Powell2021)? Could they serve as sites for societal issue articulation as well as official accounts, affected communities rather than data businesses, data commons rather than data capitalism, public–common partnerships rather than public-private partnerships?Footnote 38 Rather than thinking of data portals instrumentally in relation to more liberal, minimal conventions of opening up government information (Gray, Reference Gray2018a), could they be envisaged as sites of social learning (Williams et al., Reference Williams, Stewart and Slack2005), experiments in participation (Lezaun et al., Reference Lezaun, Marres, Tironi, Felt, Fouche, Miller and Smitt-Doer2016), or as test sites (Marres and Stark, Reference Marres and Stark2020) around the changing roles of institutional data in society? What could a feminist, ecological, decolonial, new economy or post-platform data portal look like? As well as sharpening critique, device-oriented approaches may also surface how data portals do not go according to plan or may give rise to unexpected encounters and interactions, such as through unsuccessful and unanswerable data requests. Perhaps in the details of such materials may be found clues as to what portals might look like if they served not only to serve up official representations and responses to requests, but also were alive to questions, curiosities, and concerns which could inform other kinds of data infrastructures and arrangements (Gray et al., Reference Gray, Gerlitz and Bounegru2018; Gray, Reference Gray2018b). Close attention to the details of interfaces, software, and metadata, may provide inspiration for how these might be repurposed, re-appropriated, and recomposed with other values and sensibilities, should circumstances arise.
Acknowledgments
Research for this article draws on my Data Worlds book, under contract with MIT Press. The digital methods approaches were developed as part of my affiliation with the Digital Methods Initiative (https://digitalmethods.net/) at the University of Amsterdam, which began in 2014, including “GitHub as Transparency Device in Data Journalism, Open Data and Data Activism” co-convened with Liliana Bounegru and Stefania Milan at the Digital Methods Summer School 2015; “What Do Data Portals Do?” co-convened with Sabine Niederer at the Digital Methods Winter School 2017; and “Is this Open Data Portal Accessible?” at the Digital Methods Summer School 2017 co-convened by Guillén Torres and Jeroen de Vos. I’d particularly like to acknowledge all involved in the “What Do Data Portals Do?” project, upon which this article draws, including Sabine Niederer, Geoffrey Bowker, Robin Boast, Agata Brilli, Cristina Cochior, Eline Meissen, Federico Piovesan, Frederika Mellyana, Judith Veenkamp, Lorenzo Piazzoli, Maris Männiste, Olga Resetnaka and Zeynep Yavuz. Some of the earlier research for this article was undertaken while I was a postdoctoral research on the DATACTIVE project (European Research Council, StG-2014_639379, https://data-activism.net) from 2015-2016, with Stefania Milan as Principal Investigator, as well as during a Prize Fellowship at Institute of Policy Studies (IPR) at the University of Bath from 2016-2017. Conversations and exchanges with Anne Washington surfaced transatlantic affinities and provided encouragement to continue developing this work amidst challenging times. The Data Portal Explorer tool (https://publicdatalab.org/projects/data-portal-explorer/) was developed with Jose Miguel Monteiro Vieira, supported by a seed fund grant from the Department of Digital Humanities at King’s College London together with King’s Digital Lab in 2018 together with other colleagues at the Public Data Lab. Thanks to Sebastian Stros, Elena Wüllhorst, Khizer Sajid for their contributions to exploratory research which informed this paper, undertaken as part of the King’s Undergraduate Research Fellowship (KURF) scheme in Summer 2021. Finally, I’m most grateful for feedback and encouragement from participants at workshops and conferences where earlier versions of this work were presented, including a keynote at the Digital Methods Winter School 2017 at the University of Amsterdam; the Data Publics conference at Lancaster University; the Open Data Movements in the Age of Big Data Capitalism workshop at the University of Westminster; the International Conference on Public Policy 2017 at the National University of Singapore; the Outnumbered! Statistics, Data and the Public Interest workshop at the University of Cambridge; a keynote at Deuxième Journée Open Data: Culture des données et données pour la culture, at the Université Paris Nanterre, Paris; the Media and Publics Conference at Roskilde University; a keynote at the Citizen Friendly Data Communication conference, Tilburg University; and a talk as part of the Seminar of the Society for the Social Sciences of Quantification (SSSQ) in Paris.
Funding statement
This research was supported by several internal grants from King’s College London. The funder had no role in study design, data collection, and analysis, decision to publish, or preparation of the manuscript.
Competing interests
During his graduate studies the author was previously director of policy and research at the Open Knowledge Foundation, a non-profit organization that initiated the open-source CKAN data portal software.
Author contributions
Writing: original draft—J.W.Y.G.; Writing: review & editing—J.W.Y.G.
Data availability statement
Data, code and other materials associated with this article can be found at: https://jonathangray.org/dataportals and https://publicdatalab.org/projects/data-portal-explorer/.


 Open access
Comments
No Comments have been published for this article.