 Actively Managed Equity
 Overview: All Strategies
 Investor Resources
 Indexed Equity
 Private Equity
 Digital Assets
 Invest In The Future Today
 Take Advantage Of Market Inefficiencies
 Make The World A Better Place
 Articles
 Podcasts
 White Papers
 Newsletters
 Videos
 Big Ideas 2024
A Framework for Valuing Bitcoin


This third and final part of our Bitcoin series introduces a framework for active managers to analyze bitcoin fundamentals in a way not possible for traditional assets. The three-layered pyramid shown below depicts the fundamentals, the lower layers serving as building blocks for the higher layers.
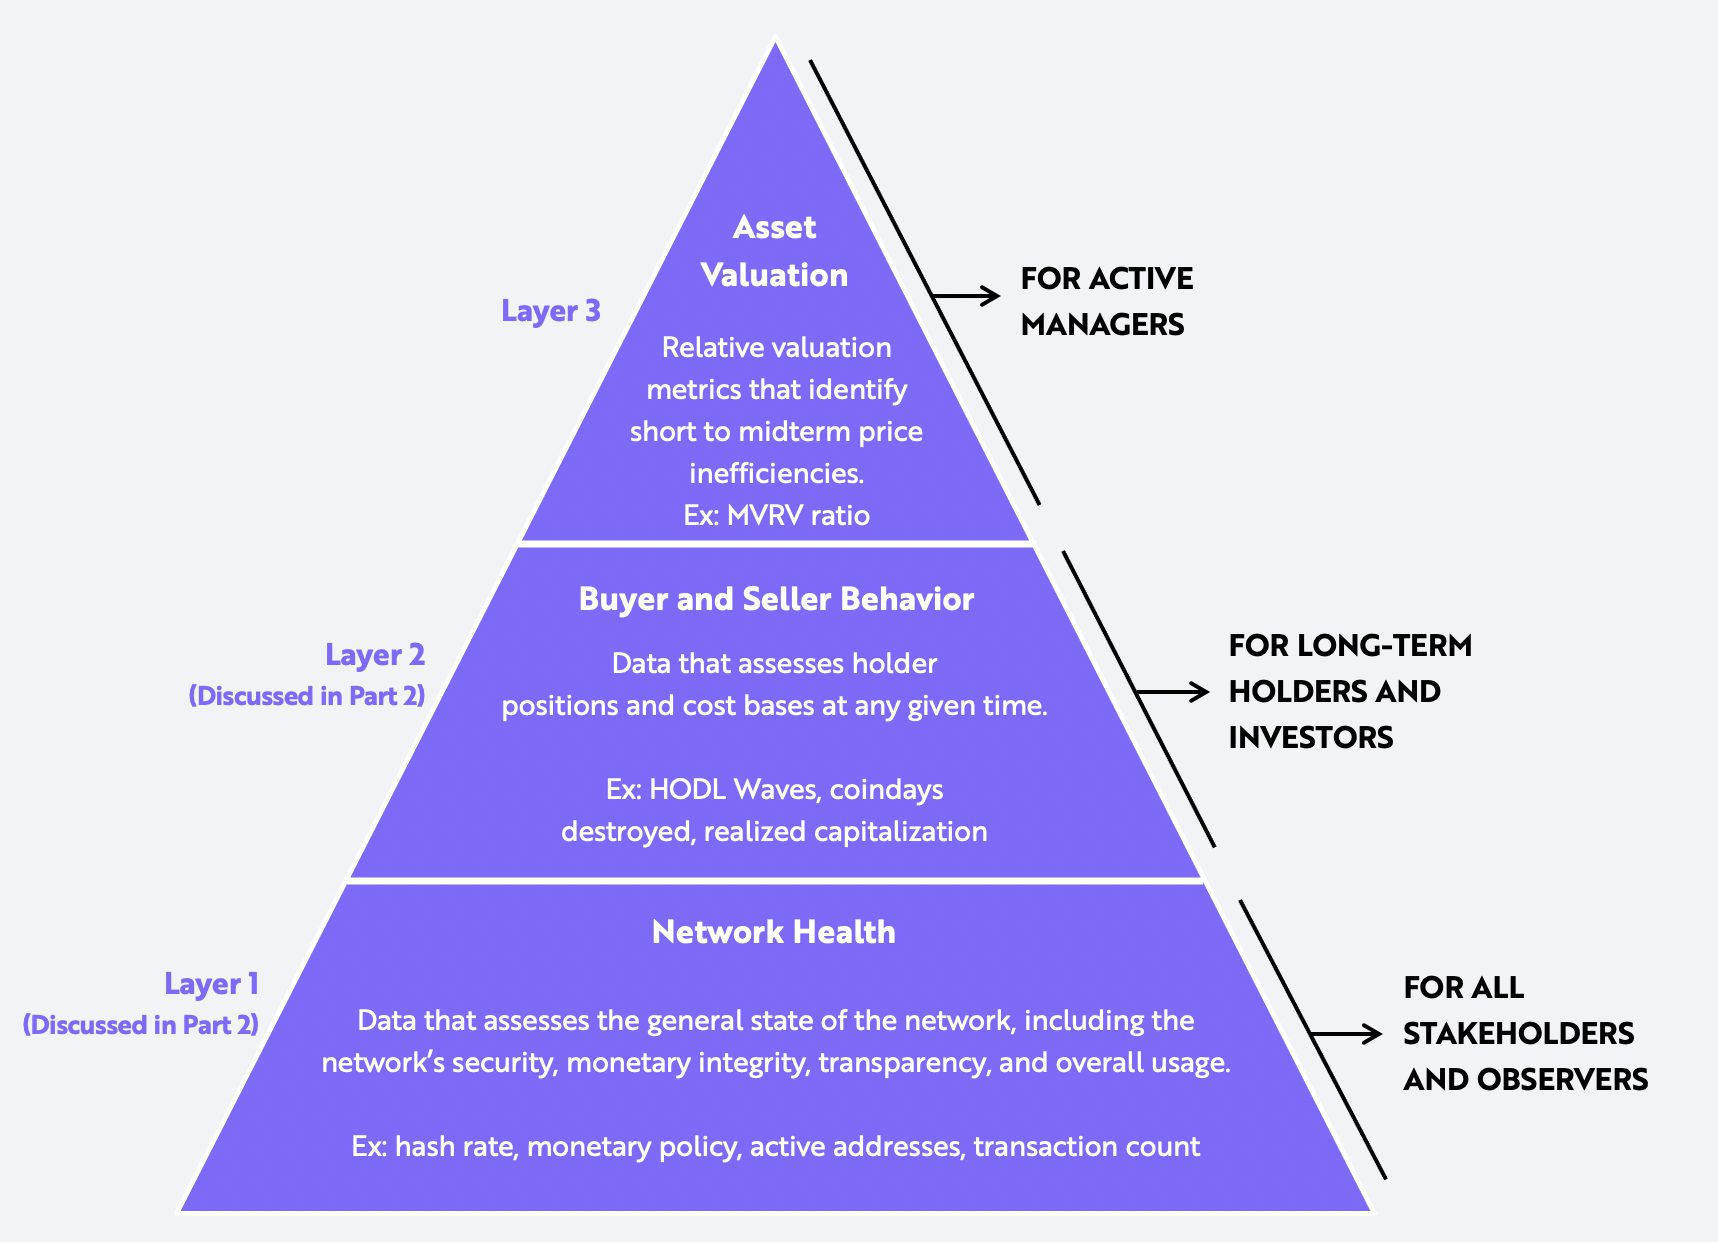
Note: MVRV (market-value-to-realized-value) is a ratio used to assess bitcoin’s market cycles over the long term. HODL, derived from a misspelling of “hold,” refers to buy-and-hold strategies in a broad base of cryptocurrencies.
Source: ARK Investment Management LLC
In Part 1 of the series, On-Chain Data: A New Framework To Evaluate Bitcoin, we detailed data in the bottom layer of the pyramid that assess the health of the Bitcoin network. In Part 2, Buyer and Seller Behavior: Analyzing Bitcoin’s Fundamentals, we focused on data in the middle layer that assess bitcoin investors’ positions and cost bases. In the final part of this series, we explore the top layer of the data which offers buy and sell signals based on relative-value metrics similar to Enterprise Value to EBITDA (EV to EBITDA) in traditional equity analysis. With this data, we believe active managers should be able to identify short- to medium-term bitcoin pricing inefficiencies.
Based on economic flows and market participant actions, two types of on-chain metrics emerge:
Cost basis metrics are a function of the costs at which different market participants transact in bitcoin over time, including:
- Market-value-to-realized-value (MVRV) ratio
- Market-value-to-thermo-value (MVTV) ratio
- Investor capitalization
- Short-to-long-term-realized-value (SLRV) ratio
Profit and loss metrics are a function of the way in which buyers and sellers take profits and losses, both in USD and BTC terms, including:
- Realized profits-to-value (RPV) ratio
- Short-term-holder profit/loss (STH P/L) ratio
- Seller exhaustion constant
This paper explains and illustrates each of these on-chain metrics.
Cost Basis Metrics
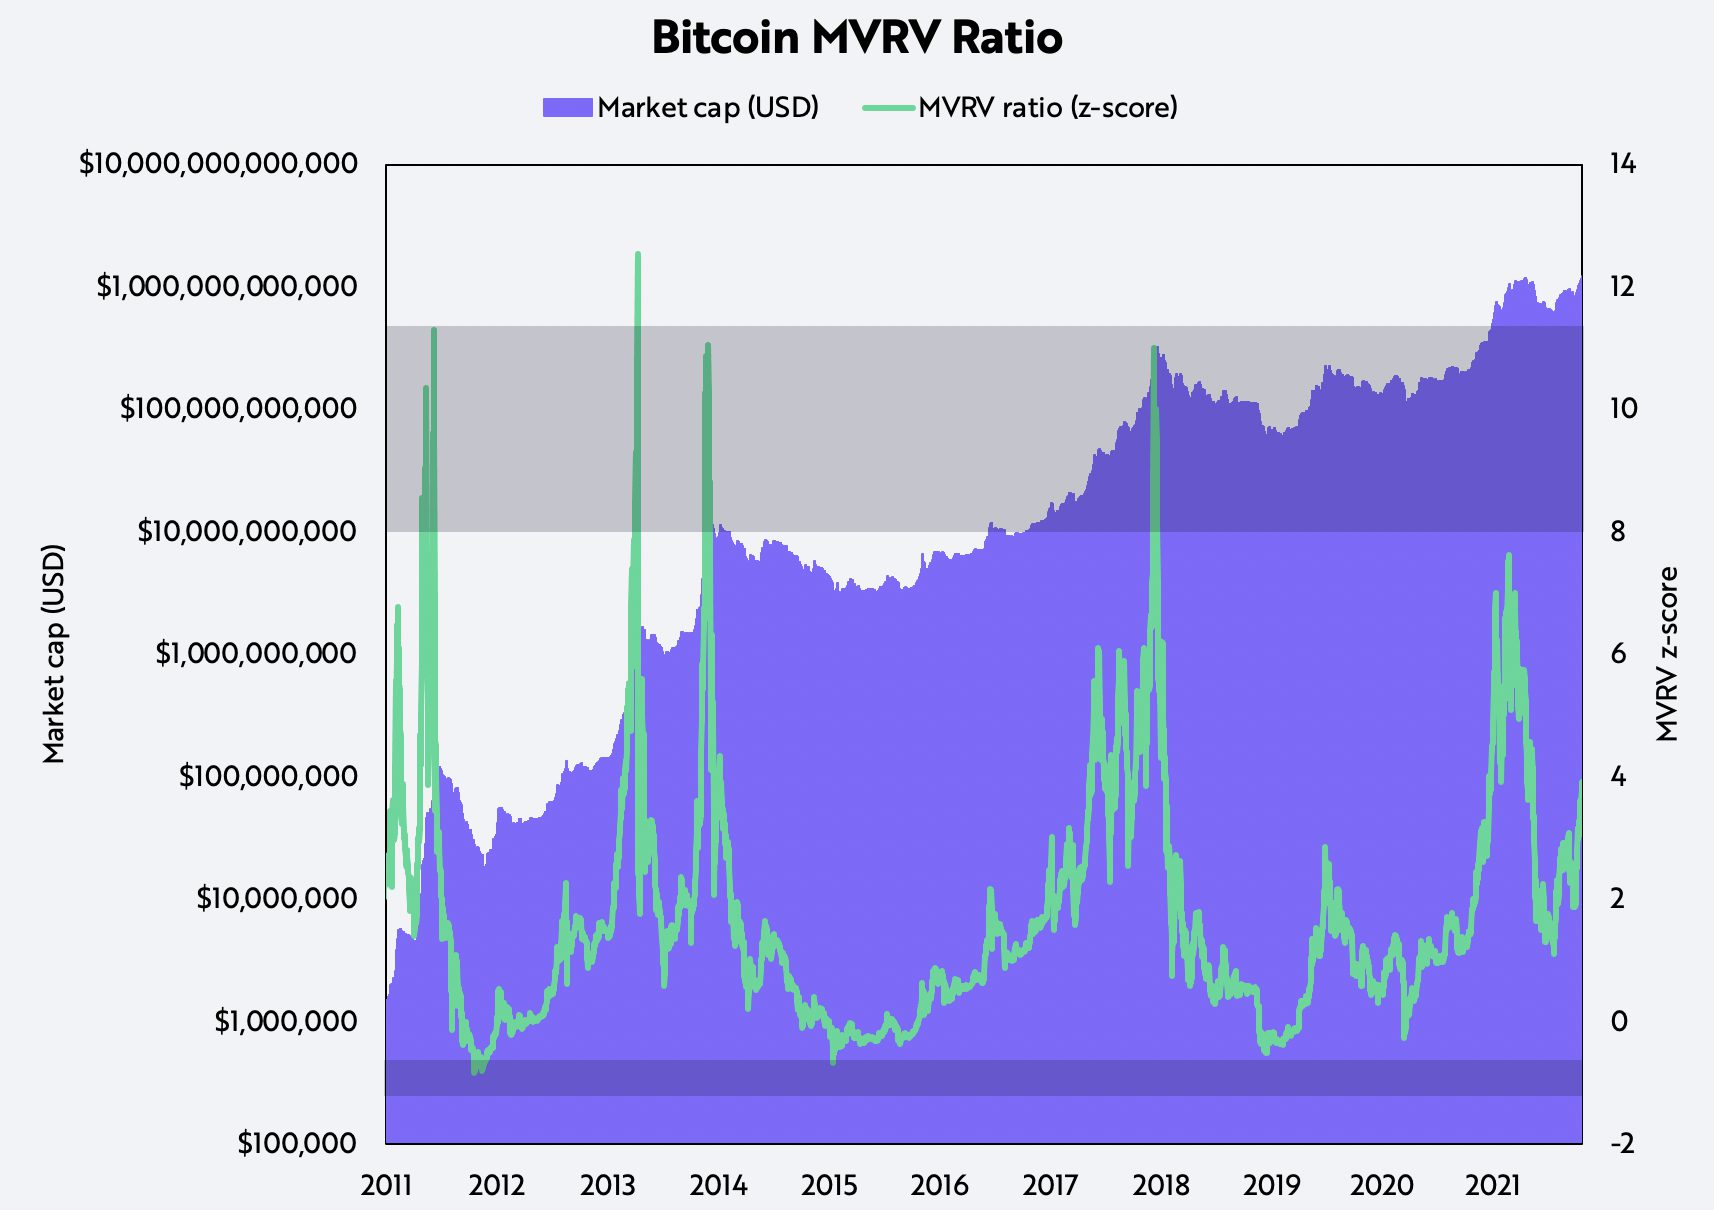
I. Market-Value-to-Realized-Value Ratio
First conceptualized by Murad Mahmudov and David Puell in 2018.
The MVRV ratio is market capitalization divided by realized capitalization, which measures the price of bitcoin relative to the average on-chain cost basis of all participants in the market. When MVRV is below 1, the market is selling at a loss, which historically has marked cyclical bottoms. Conversely, when market capitalization rises dramatically relative to average cost, bitcoin typically is poised for large-scale profit-taking.
Historically, bitcoin has topped out when the MVRV ratio has surpassed 10, as shown below. Recently, on a volatility adjusted basis, MVRV ratio hit 8, at which point the price of bitcoin dropped 53%, perhaps suggesting a local as opposed to a global top. After May’s 53% correction, MVRV on a volatility-adjusted basis went from roughly 8 to below 2. Now at 4, the MVRV ratio is in a range typically associated with neutral territory.
For informational purposes only and should not be considered investment advice, or a recommendation to buy, sell or hold any particular security or cryptocurrency.
Source: ARK Investment Management LLC
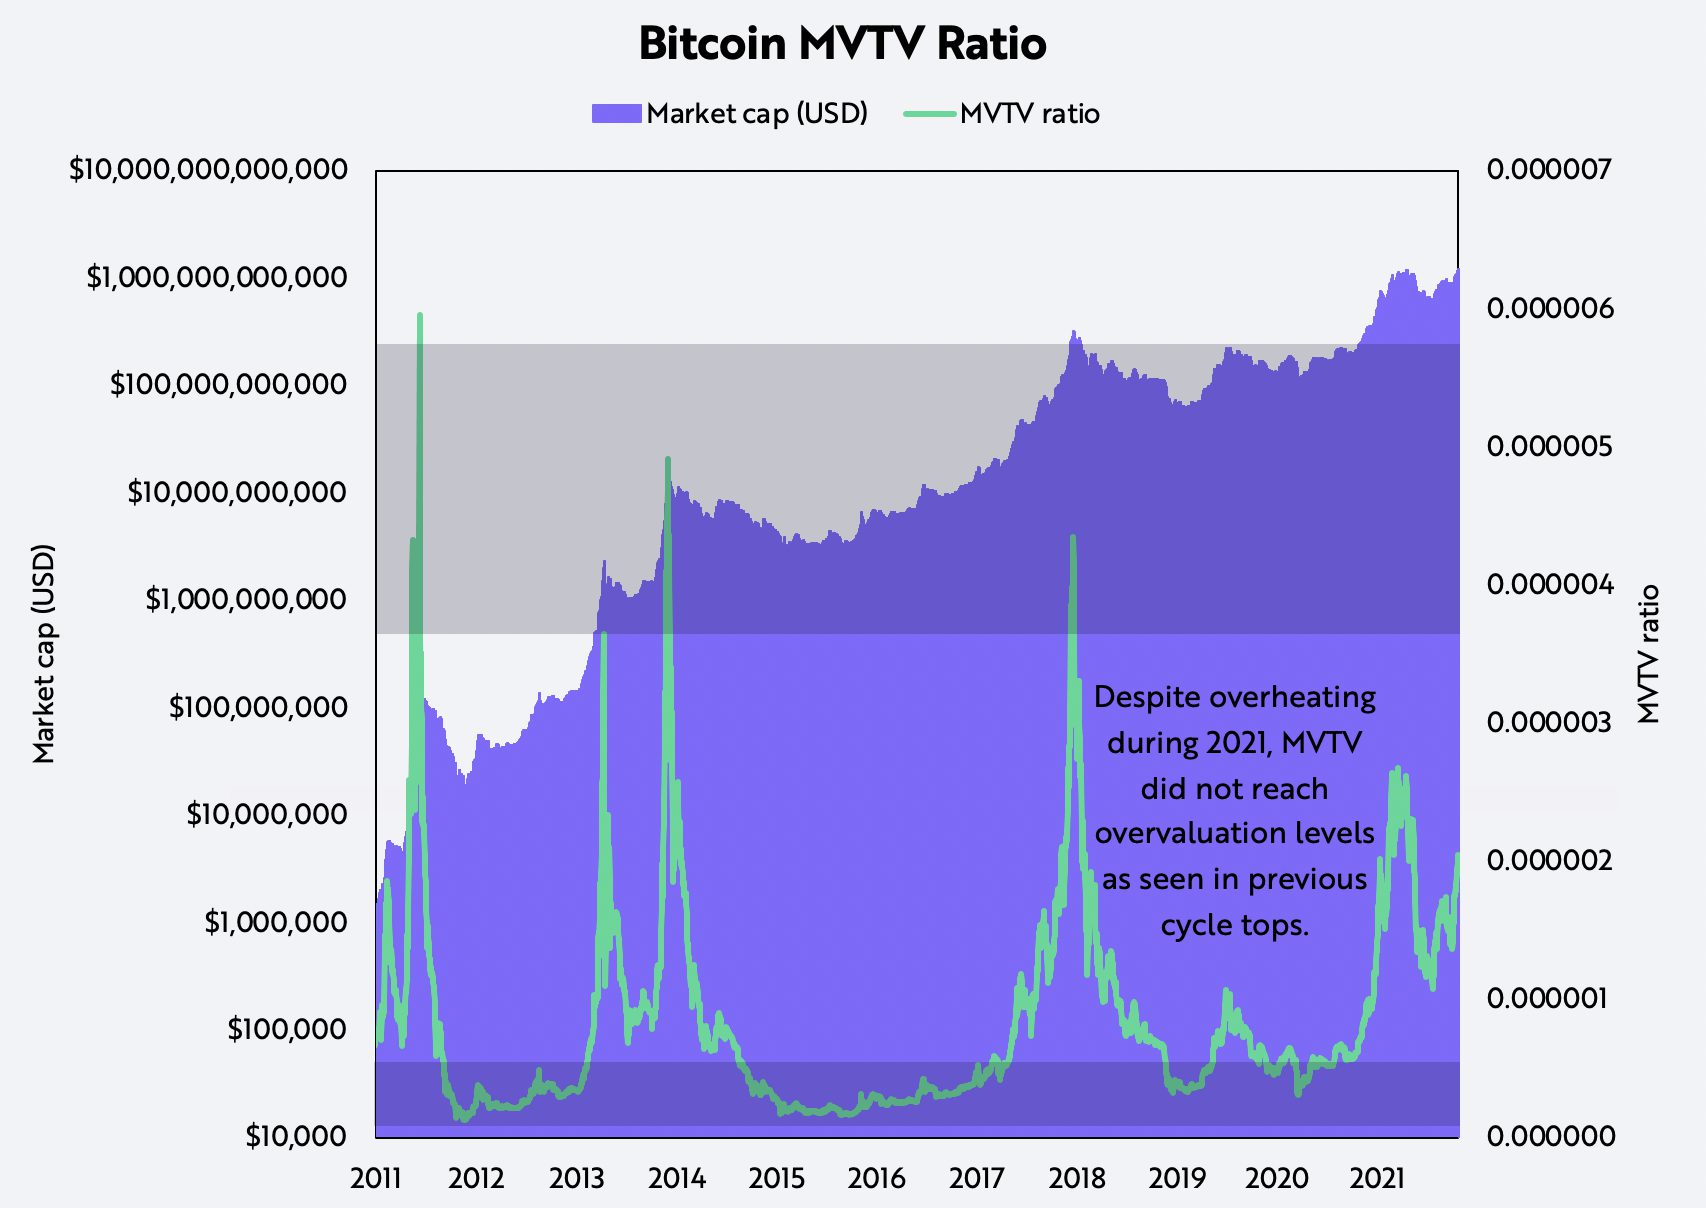
II. Market-Value-to-Thermo-Value Ratio
First conceptualized by Glassnode in 2019.
A mean reversion metric, the MVTV ratio is market capitalization divided by thermo capitalization or the cumulative USD value paid to miners to secure the network. MVTV compares bitcoin’s price to the implied value paid to bitcoin miners who, in turn, are focused on validating transactions and securing the Bitcoin network. Best explained by pseudonymous analyst GeertJancap, the MVTV ratio resembles the EV-to-EBITDA multiple used in equity valuations. MVTV compares investors’ current market cap to miners’ cash flow.
Like MVRV, the MVTV ratio suggested last April that, at $63,000, bitcoin was in a strong bull trend but that the market was not near a speculative blowoff, as shown below. The price of bitcoin has since recovered from its 50% drawdown, with MVTV also nearing its previous local high.
For informational purposes only and should not be considered investment advice, or a recommendation to buy, sell or hold any particular security or cryptocurrency.
Source: ARK Investment Management LLC
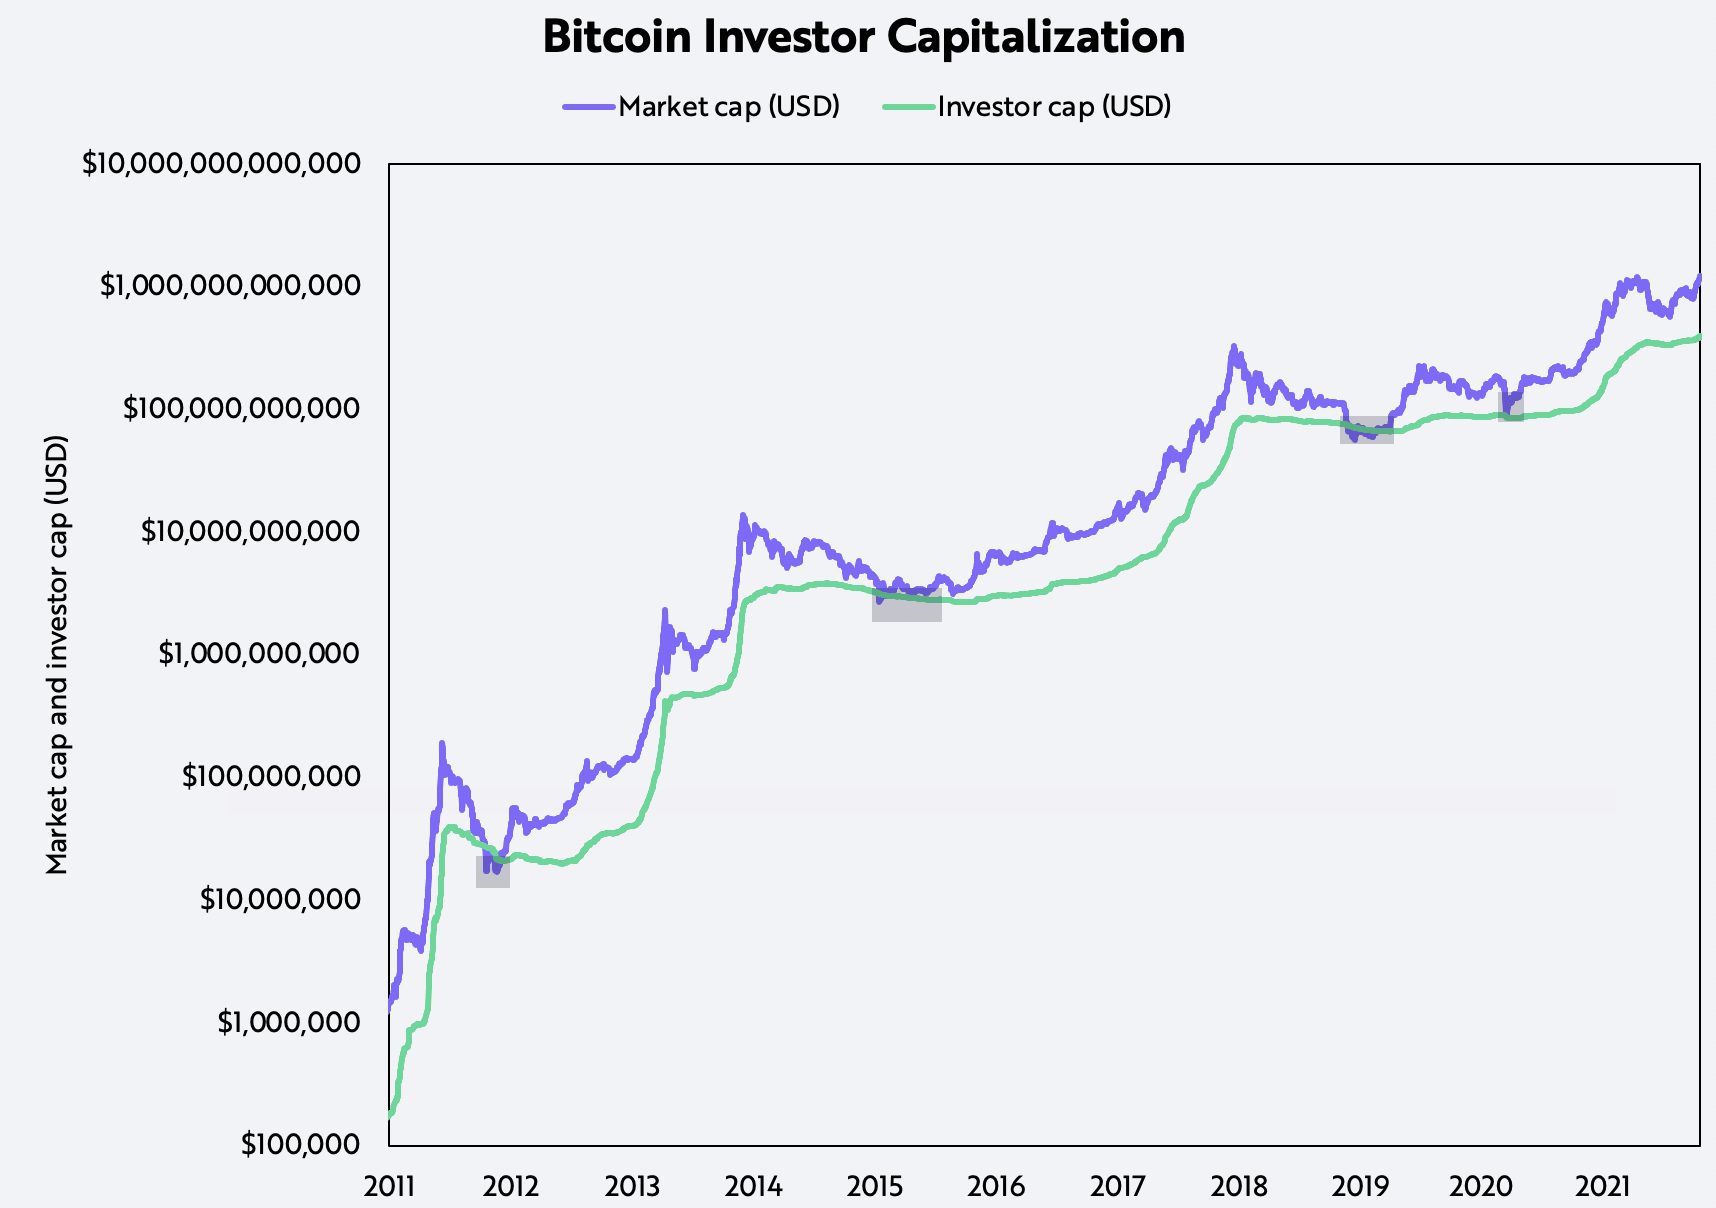
III. Investor Capitalization
First conceptualized by ARK Invest and David Puell in 2021.
Investor capitalization – realized capitalization minus thermo capitalization – can be a good gauge of capitulation during bear markets. Investor capitalization subtracts the thermo capitalization from the market’s cost basis. By removing the outstanding value paid to miners from the overall cost basis, we can assess the fair value of bitcoin at the bottom of a market cycle.
As shown below, market capitalization tends to revert toward investor capitalization during bear markets and typically inflects when they near parity. As of October 2021, investor capitalization was approximately $400 billion USD, or 68% below market capitalization.
For informational purposes only and should not be considered investment advice, or a recommendation to buy, sell or hold any particular security or cryptocurrency.
Source: ARK Investment Management LLC
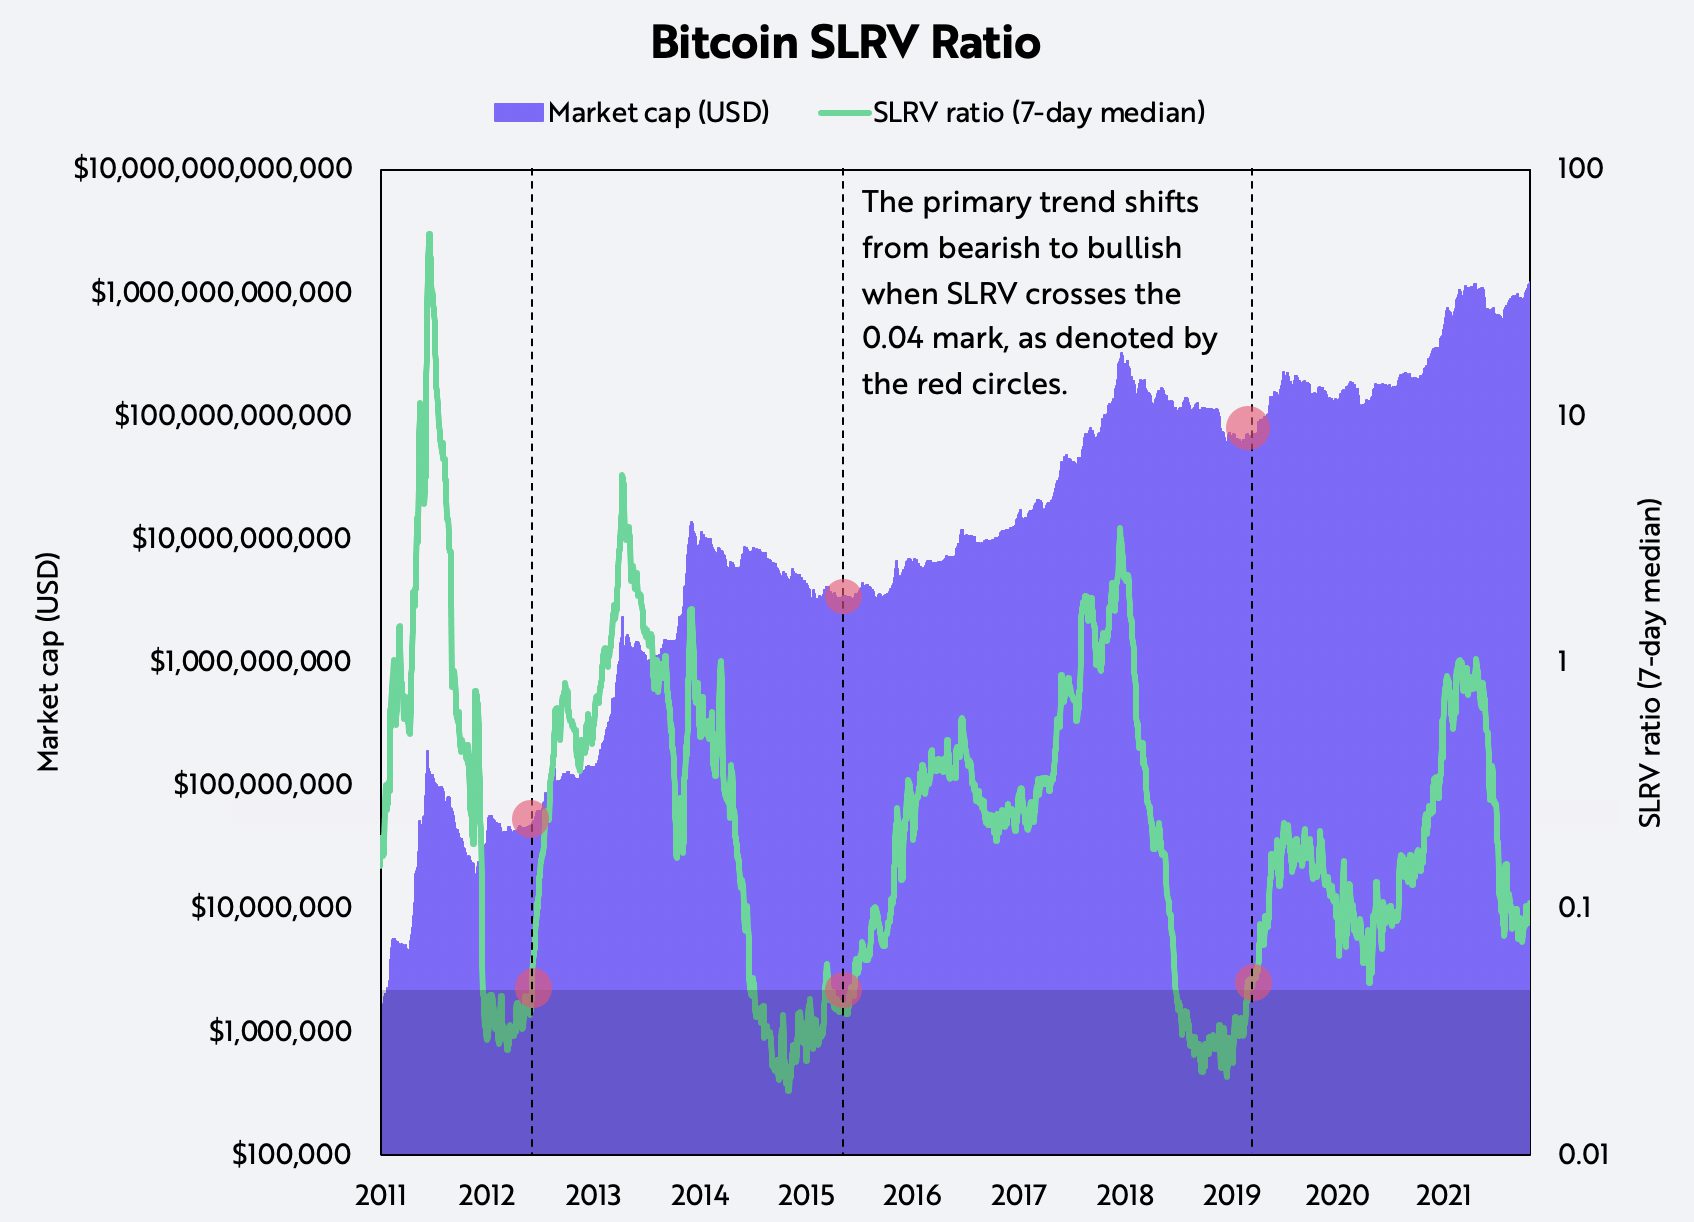
IV. Short-to-Long-Term-Realized-Value Ratio
First conceptualized by ARK Invest and David Puell in 2021.
The SLRV ratio is the one-day HODL wave divided by the six-month-to-one-year HODL wave, both weighted by realized capitalization. This metric compares the number of bitcoins moved per day to the number moved six months to one year previously: in other words, short term velocity relative to medium- and long-term velocity. This ratio illustrates how complex calculations can detect price inefficiencies. Historically, a ratio below 0.04 has been associated with bear markets when short-term velocity is low, suggesting apathy, relative to medium- and long-term velocity.
When the ratio moves above 0.04, a new bull move tends to be underway, as shown below.
For informational purposes only and should not be considered investment advice, or a recommendation to buy, sell or hold any particular security or cryptocurrency.
Source: ARK Investment Management LLC
Profit and Loss Metrics
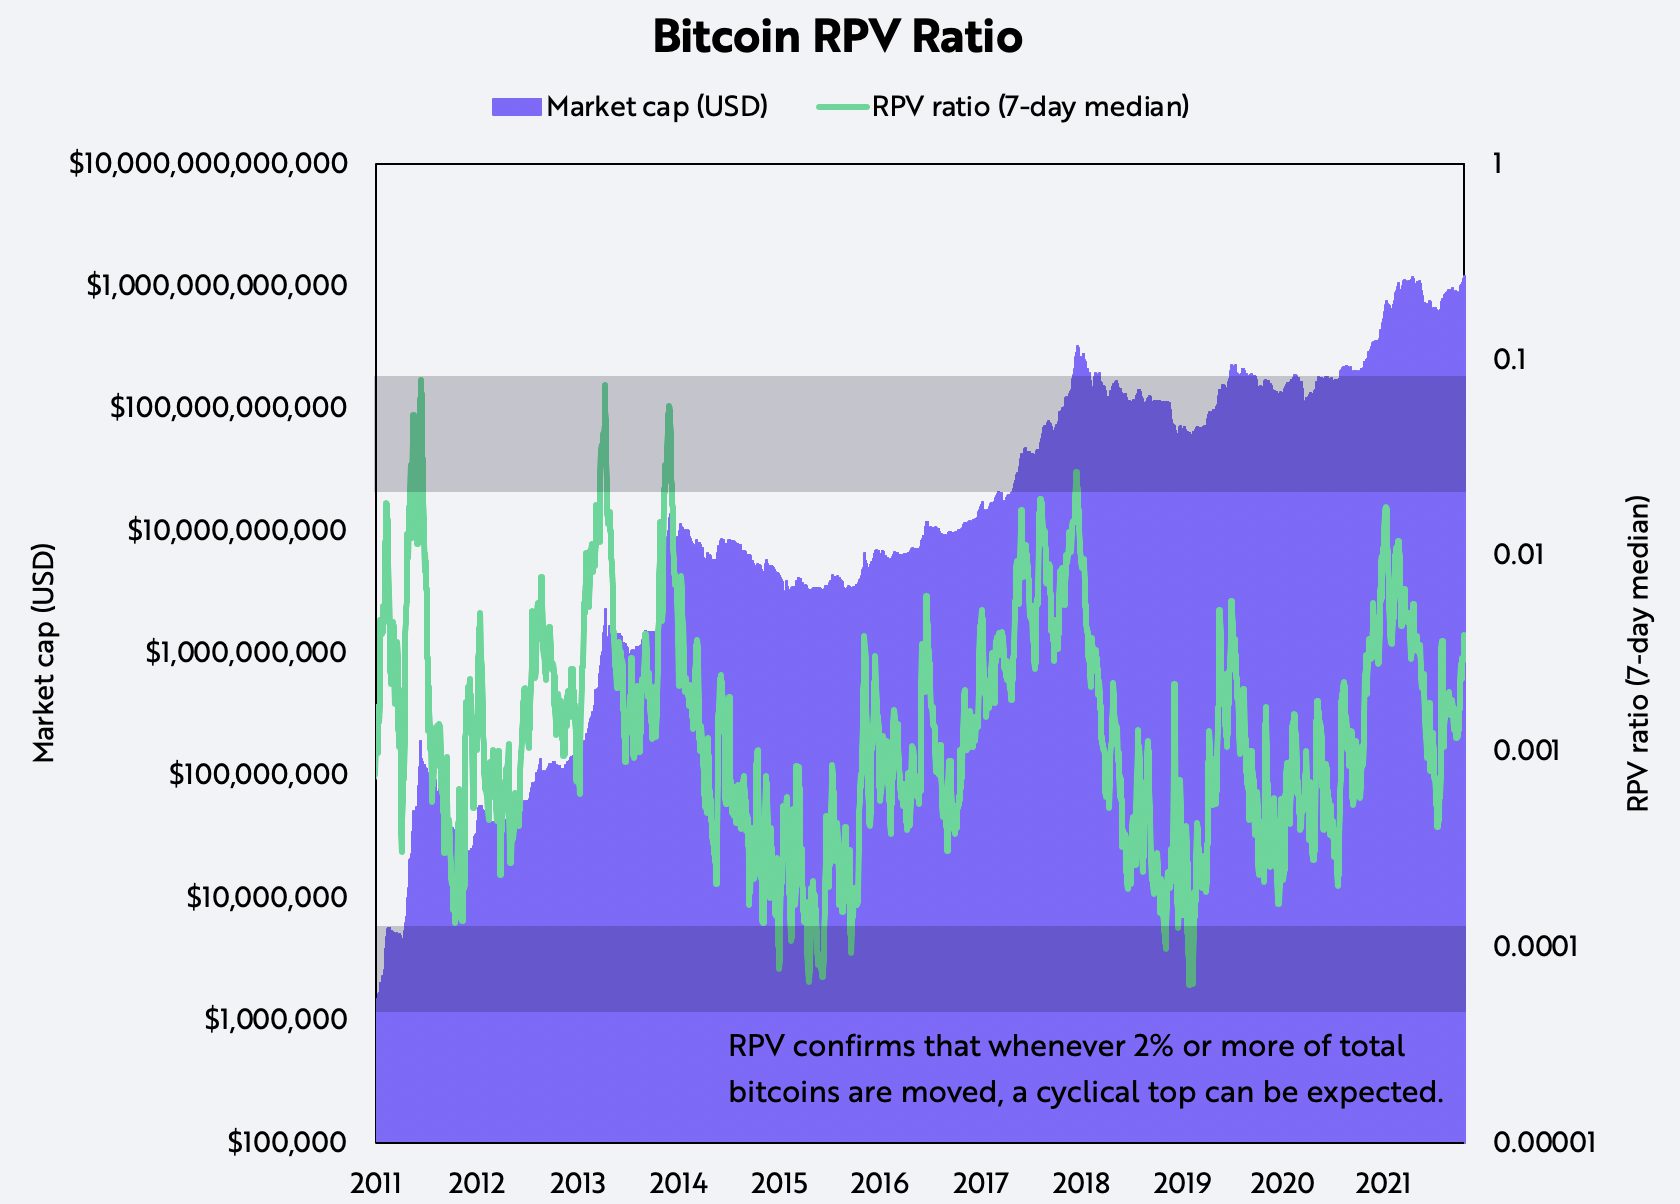
I. Realized Profits-to-Value Ratio
First conceptualized by ARK Invest and David Puell in 2021.
The RPV ratio is realized on-chain profits in USD divided by realized capitalization, measuring the difference between daily profit-taking behavior and buyers’ average cost basis. A ratio of 1 – which never has occurred – would indicate that every bitcoin is moving on that particular day. Historically, when profit-takers have moved 2% or more of their holdings in one day, the market has hit a cyclical top. Conversely, when they have moved only 0.001% of their coins in one day, the market has been in the process of bottoming.
After reaching levels of exuberance slightly below 2 earlier this year, followed by the 53% drop in the bitcoin price, the RPV ratio has reset to much healthier levels, as shown below.
For informational purposes only and should not be considered investment advice, or a recommendation to buy, sell or hold any particular security or cryptocurrency.
Source: ARK Investment Management LLC
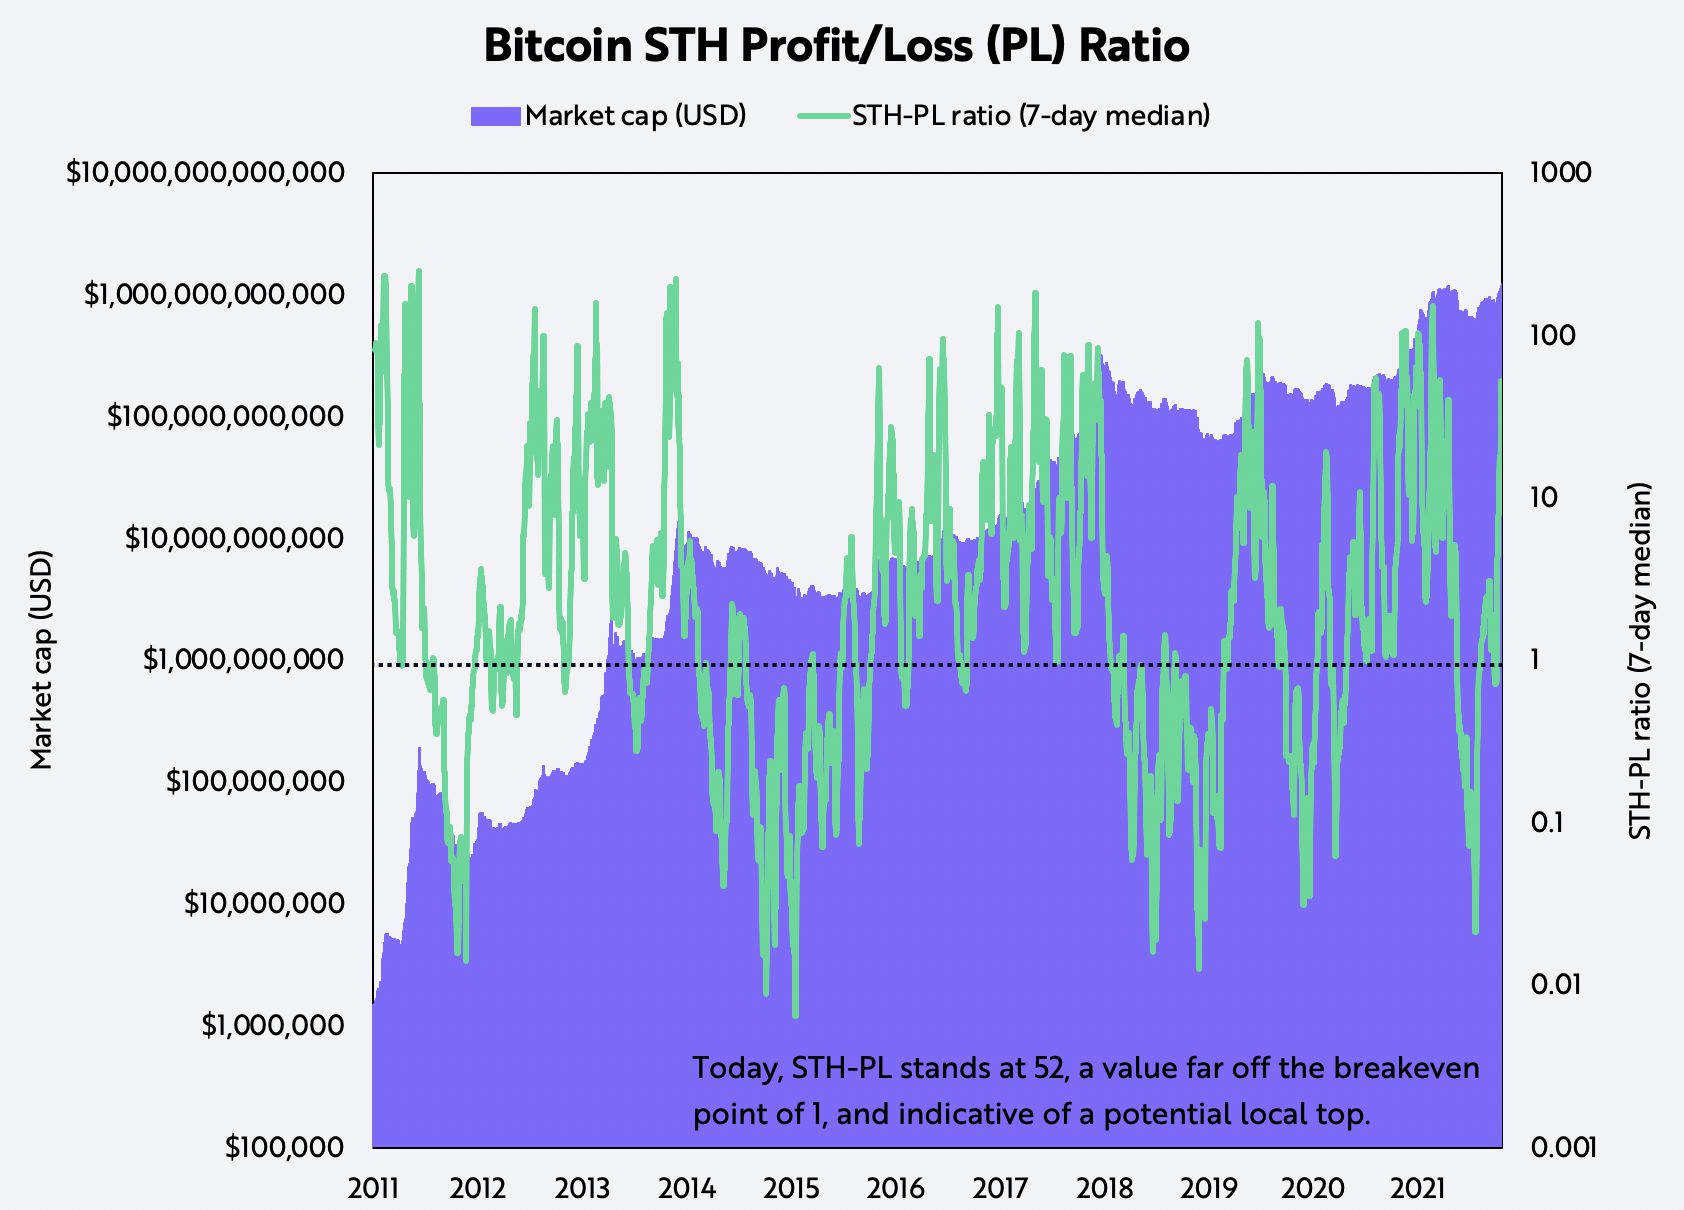
II. Short-Term-Holder Profit/Loss Ratio
First conceptualized by ARK Invest and David Puell in 2021.
Another measure of price inefficiencies is the Short Term Holder (STH) Profit/Loss (P/L) ratio, which is the short-term supply of bitcoin at a profit divided by the short-term supply at a loss. A ratio of 1 typically is associated with local bottoms in bull markets and local tops in bear markets. When the ratio is below 1, in the aggregate market participants who have moved coins in the last 155 days have losses. Conversely, when the ratio is above 1, short-term participants have an aggregate gain. When selling off around a ratio of 1, bitcoin typically has entered a bear market.
After bitcoin’s 53% correction from $63,000 USD to roughly $30,000 this past spring, its STH P/L ratio stabilized around 1, as shown below, suggesting that it was bottoming out. Today, STH P/L stands at 52, a value indicative of a potential local top.
For informational purposes only and should not be considered investment advice, or a recommendation to buy, sell or hold any particular security or cryptocurrency.
Source: ARK Investment Management LLC
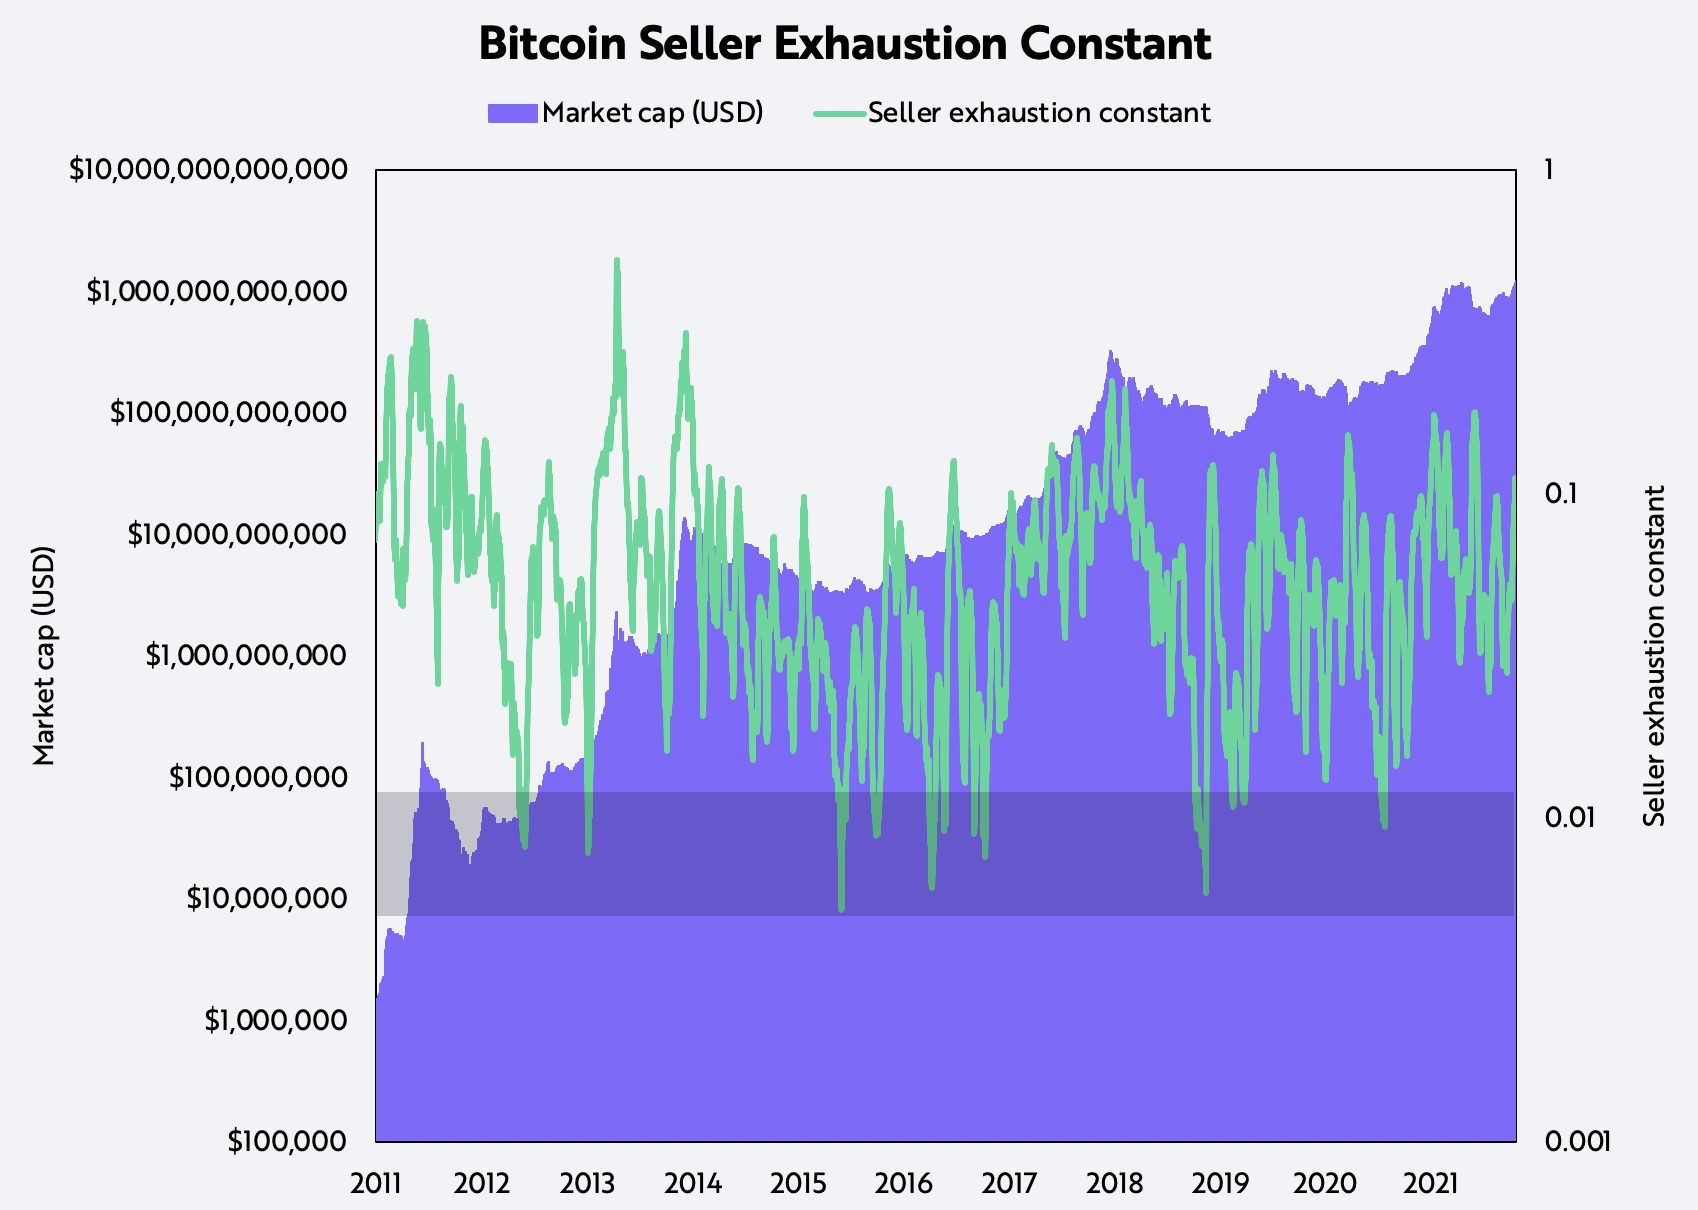
III. Seller Exhaustion
First conceptualized by ARK Invest and David Puell in 2021.
Lastly, combined with profit metrics, volatility can be an important guide to bitcoin’s future price action. The seller exhaustion constant shown below is the percentage of bitcoin total circulating supply in profit multiplied by its volatility over the last 30 days. This metric measures whether the two factors align. Specifically, the combination of low volatility and high losses is associated with capitulation, complacency, and a bottoming out of the bitcoin price.
For informational purposes only and should not be considered investment advice, or a recommendation to buy, sell or hold any particular security or cryptocurrency.
Source: ARK Investment Management LLC
Conclusion
Because Bitcoin – the blockchain – and bitcoin – the cryptocurrency – do not resemble traditional asset classes, many investors seem to be grappling with ways to analyze them fundamentally. In our view, Bitcoin’s value is a function of its economic utility, while bitcoin’s value is a function of its supply and demand. Over the short- to medium-term, we believe investors should be able to assess buyer and seller behavior on Bitcoin and use relative-value metrics to manage bitcoin positions actively.
Hopefully, this series has illustrated how investors can evaluate the investment merits of bitcoin in the context of cost as well as profit and loss metrics.