

The Dreams of Yesteryear

In March of 2020 I received word from PNC that my team and I could no longer come into the office. The FinTech company who employed me at the time was re-badging a group of about 30 employees from PNC’s imaging center in Dayton, OH as they prepared to automate imaging and retire this group of individuals. As a way to transfer reputational risk, PNC left it to my company to lay them off later in the year…an election was coming, so you know.
I was living in corporate housing in Dayton, Ohio, but had kept my apartment adjacent to a mixed-use corporate office park in Pittsburgh called Southpointe because no one knew how long I needed to be in Dayton. I had chosen the location when I first moved to Pittsburgh to join the above-mentioned FinTech company because it was close to the main N/S corridor, and they were building an airport connector nearby (which although completed, no one uses as it is a pricey toll road and the main corridor is just as fast). Additionally, I assumed that these were my people as it was a travel-to-work oasis with hotels and a little Main Street with plenty of restaurants and services. Away from tunnel traffic, nestled in the hills of PA, replete with all the amenities and watering holes you would need after a tough day, Southpointe seemed like the perfect spot for someone like me….someone who never lived where they slept, but “hoteled”, always close to work.
So, having been banished from Dayton, I returned to Pittsburgh to set up shop in an apartment I had never really inhabited. By April of 2020 Southpointe was a complete ghost town.
According to Wikipedia:
“Southpointe is a 589-acre (238 ha) suburban business park located in Cecil Township near Canonsburg, Pennsylvania, south of Pittsburgh and is a familiar landmark along Interstate 79. It is home to many corporations, including Fortune 500 members CONSOL Energy and Viatris as well as Ansys.
Since the development of the Marcellus Shale in the Appalachian region, Southpointe has also become home to many natural gas producers, including Range Resources, Noble Energy, EQT and other service companies related to the industry.
Southpointe is also home to the PrintScape Arena at Southpointe, which was the main practice and training facility for the Pittsburgh Penguins from May 20, 1995 until 2015. Since 2010 its golf course has hosted the PGA Tour event Mylan Classic.
Planning for what would become Southpointe began in the 1980s, as the Washington County Redevelopment Authority in partnership with the RIDC began to pursue a tract of land in Cecil Township that had been the site of the Western Center, a reform school and a state mental hospital. The property for the first phase, Southpointe I, was acquired in 1986, with construction beginning in 1993. The location was chosen because of its access to Interstate 79, its proximity to Pittsburgh and low tax rates. By 2013, Southpointe had become filled and the second phase, Southpointe II neared completion, with 800 acres (320 ha) across both. A third phase is planned for the other side of Interstate 79, to be called Cool Valley Industrial Park.” (my emphasis)
There will be no third phase, or at least not as imagined.
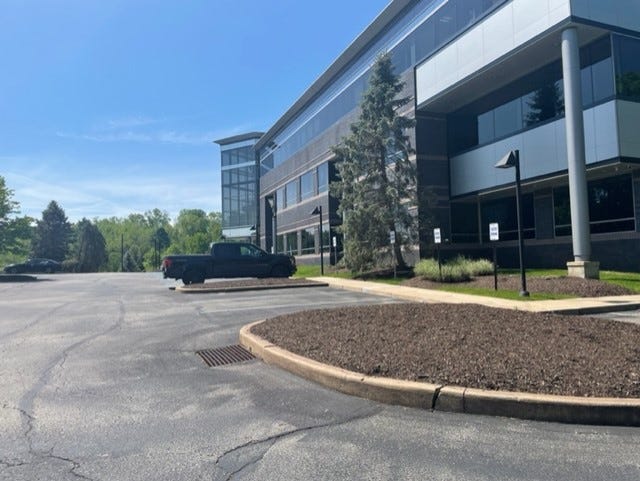
This is the Viatris building which was completely empty when I drove by yesterday (all pictures were taken between 10-12pm on Monday, May 15th):

The developers of Southpointe dreamed of a sophisticated and vibrant community with condos, apartments and homes adjacent to upscale offices for an integrated work and play model, inclusive of an urgent care and Doodles Day Care.

Employee outing? Let’s head over to the golf course. Need some exercise, check out the state-of-the-art gym in this cool building:

Except things have changed. Currently, in this building the below office space is available in the next 30 days or NOW:

Although I do not know the exact count, this is a snip from LoopNet of the multiple office buildings located in the office park (cluster to the left of the highway):


None of these buildings are full. The day care and urgent care had barely a car in the parking lots.

In commercial real estate (CRE), many of the loans are non-recourse meaning that lenders cannot go after the assets of the borrowers and owners will likely hand the keys to the bank if they cannot get new financing to extend and pretend.

And, lest we forget, it is not just the banks that should be concerned - no, not in our hyper-financialized economy - as these loans were securitized and sold to all sorts of investors. According to one recent post (thank you to Rudy Havenstein for the link):
“The entire commercial office space market is $3.2 trillion. And we’re looking at a decrease in value of 40-80%. That would be marked to market losses of $1.12 to 2.3 trillion.
Quite simply, this is going to make 2008 look like a trial run.”
Harsh words, but I cannot disagree after what I’ve seen on the road and yes, right next door.


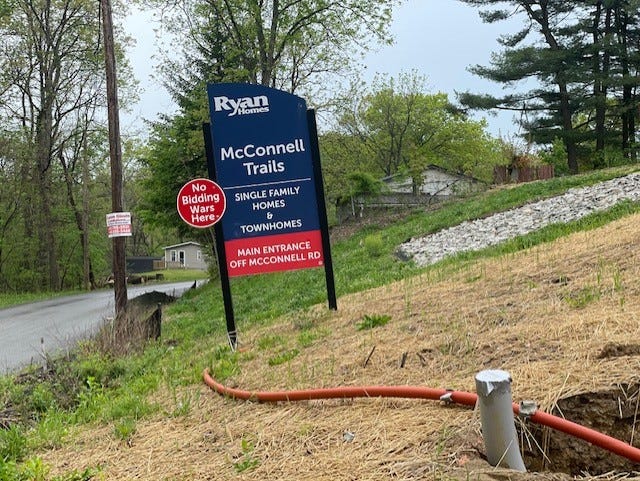
And, what of the apartments and single-family homes to support this giant office park? No faith, you have. Did you think I would forget? The main multifamily complex is currently showing 96% occupancy on RealPages, but I wonder how many of these are corporate housing because I never see anyone there anymore. And, the adjacent Chop House has closed. A new one is supposed to be coming, but you know….I’ve seen a lot of Coming Soon signs in the last few months. Our ongoing credit crunch and banking crises might have something to say about that with projects and leases being bought out early. Just think about Toast who recently paid $16M to get out of its lease at Fenway and didn’t even want to bother finding someone to sublease.
Just down the back-road there is a large single-family residential new-build which has been in progress for the last three years. They’ve made a significant amount of progress in the last year and listings in Pittsburgh have increased by 18% since I started tracking them in January. That might have something to do with tech layoffs and the declining demographic picture as well with Pittsburgh seeing negative population growth in 2021. Can’t be certain, but unless someone or something comes along to revive this failed office park, I’m not sure who will be buying these new homes as there are much closer options to Pittsburgh.


And, that is indeed the point I keep trying to make….everyone, and I mean everyone, is so focused on what the Fed will and will not do, but this train has left the station in many cities. Even if the Fed were to pivot, who will fill these office buildings? Who will live in the new-builds which are largely too expensive? At this moment, demographics are declining, not rising like they were the last time we had this much housing in progress.
Commercial and residential go hand-in-hand. And, many, many housing projects have been started to support these sparkly new buildings, some of which are half-built in cities like Dallas and Austin. For anyone who thinks housing is not about to have its day in the spotlight - again - just take a little tour of your metaphorical backyard. Have projects that were slated been cancelled? Are the parking lots filled outside those gleaming new office buildings? For now, the grass is still getting mowed (on most), the shrubs are getting cut and the power is still on in these large buildings, but what happens when these building owners decide they can’t handle the expense? Don’t let landscaping fool you…..this crisis is hiding in plain sight.
This week’s updates:
YouTube video:
Listings for Sale
Of 60 cities tracked this week, 43 had increases in listings for sale.
Top Cities with Largest % Increase in Inventory Week-over-Week (5//7-5/14)
Coeur d’Alene 7.51% (this is not good)
San Ramon 6.60%
Boise 4.55%
Salt Lake City 3.99%
Portland 3.86%
Note: Las Vegas still trending in the same neighborhood, but net slightly negative.
Top Cities with Largest % Increase in Inventory from Start (1/1/23)
San Ramon 88.33%
San Francisco 74.98%
Coeur d’Alene 55.70%
San Jose 50.56%
Denver 50.53%
Austin 40.38%
Hoboken 30.14%
Boston 38.62%
Rent
Rents on RealPages settled this week with very little movement, so updates from last week are in the reference section. Instead, check out this Redfin article about cooling rents and some stats from their platform. Austin, as I’ve been saying for some time, is in trouble.

Airbnb
Always perplexed by human behavior, especially my own, I found this week’s Airbnb NON-movement on prices for Memorial Day very interesting. Out of the 60 cities tracked, only nine cities had price changes. I think folks desperately hope they are going to be able to find some takers at the current prices. So, so curious about what next week will bring.
Top Cities with Airbnb Average Price DECREASES for Memorial Day Weekend.
Bakersfield - 5.84%
Austin -5.22%
Dallas -3.85%
Ft. Lauderdale - .92%
Top Cities with Airbnb Average Price INCREASES for Memorial Day Weekend.
Las Vegas 7.22%
Augusta 3.98%
Asheville 2.88%
Seattle 1.83%
Indianapolis .22%
Coming Soon: YouTube video later today and next week home price updates.
Reference
Rents
Top Cities with Highest % of Average Rent Price Decreases (March-April)
Portland -6.23%
Fort Lauderdale/Miami - 5.69%
Asheville -2.12%
Tampa -1.69%
Top Cities with Highest % Decrease in Rent Per Square Foot (RPSF) for Specific New Multifamily Complexes (March-April)
Encinitas -3.57%
Ft. Myers -3.56%
Asheville -3.20%
Tampa -1.76%
Boise -1.09%
Airbnb
Inside Airbnb has published its data for March and in many cities there were increases month-over-month for listings after significant decreases the previous month. A good example is Austin which went from 18,337 listings in January to 13,808 listings in February and now up to 14,368 listings. Based on my travels I would say that a good chunk of people still think it’s 2021, especially the fix and flippers who may have been constrained by labor or supply chain issues and are coming late to the party. It will be very interesting to watch this trend for sentiment changes post the mid-March banking crisis and now subsequent credit crunch.
Some stats:
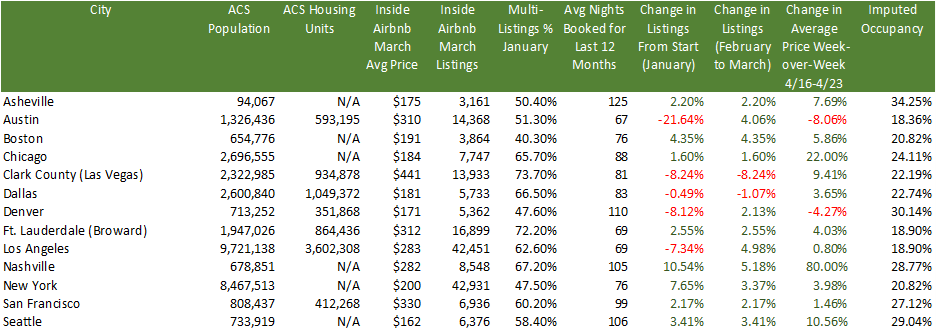
A really interesting stat above is the % of multi-listings per city. This metric represents the % of owners that list multiple properties, not just one. So, in other words, this will give you a flavor to how many investors operate in that market. The average for the cities above for multi-listings is 58.74%. So, despite what Airbnb said on that doozy of an earnings call when no one asked them about their miss in listings projections, their typical client is not someone who is trying to make just a little bit of extra cash. These are investors with multiple properties who are looking for passive income and likely bought these properties with DSCR loans or cash from loans on equity and crypto assets. And, with so many listings the imputed occupancy in these cities is very low and is likely no longer covering debt service cost.
For those who have listened to my Twitter Spaces (check out this one on Airbnb if you haven’t), you know my biggest issue with Airbnb is that besides excursions and nebulous technology improvements, adding listings is Airbnb’s only strategy for growth. I’m pretty sure there is a limit to how many hotel rooms and Airbnb listings we need in each city.
Redfin - Homebuyer Searches
I newly discovered this on Redfin’s website last week. Although searches certainly do not translate into purchases I think it is an interesting metric similar to consumer sentiment. As mentioned above, we need to be looking at more data instead of less, but none of it should be considered in isolation.
Cities with the Highest % of People Searching to Move INTO that City
Los Angeles, Costa Mesa, Newport Beach, Palm Springs 6.0%
Chicago 4.0%
Seattle 4.0%
Cities with the Highest % of People Searching to Move OUT of that City
Tucson 61%
Destin 49%
Huntsville 41%
Asheville 39%
Demographics
The demographic story has been one of the biggest drivers of narratives in the media. Unfortunately, those narratives are conflicting and source-dependent. I’m working on a full post comparing Census, NAR, UHAUL, United and I finally found some cell data so hope to have that finished soon.
ACS Population Change from 4/1/20-7/1/2021
Top 3 Cities with Highest % of Positive Population Change
Ft. Myers +7.9%
Bentonville +4.8%
Coeur d’Alene +2.5%
Top 3 Cities with Highest % of Negative Population Change
San Francisco -6.7%
New York -3.8%
Boston -3.2%
Cities with the Lowest Inflation-Adjusted Median Average Salary
Knoxville $50,245
Augusta $52,286
Johnson City $53,572
Miami $54,273
Tucson $54,498
Ft. Myers $58,607
END
People are wanting to move OUT of Huntsville? I thought that was a hot spot.
Really respect the amount of data you pour through to write this stack. Here in mid-Missouri, a college town we have few homes up for sale. Homeowners are remodeling or adding outdoor projects instead. New homes are slab, smaller and cost as much as big homes built 10 years ago on an acre. To Boomers wanting to downsize it’s a joke comparison....so they put in a pool or remodel the kitchen. Many already have second homes in Florida or condos in Colorado. If and when this market/economy explodes it’s going to be a major shock to these professionals that are drowning in stuff and things.
P.S. half this town is getting on an airplane heading overseas this summer. STL Cardinals are playing in London. 😳