Thread
1/
Get a cup of coffee.
In this thread, I'll help you understand the Volatility Tax.
Whether you're a fundamentals-driven, buy-and-hold investor or an esoteric derivatives trader, this thread will help you hone your craft -- by sharpening your probabilistic reasoning skills.
Get a cup of coffee.
In this thread, I'll help you understand the Volatility Tax.
Whether you're a fundamentals-driven, buy-and-hold investor or an esoteric derivatives trader, this thread will help you hone your craft -- by sharpening your probabilistic reasoning skills.
2/
Imagine we have 2 stocks: A and B.
A is the ultimate steady compounder. Each year, the stock rises 15% -- like clockwork.
B is much more volatile. Some years, it RISES 50%. Other years, it FALLS 20%. The odds are 50/50 each year -- like a series of independent coin flips.
Imagine we have 2 stocks: A and B.
A is the ultimate steady compounder. Each year, the stock rises 15% -- like clockwork.
B is much more volatile. Some years, it RISES 50%. Other years, it FALLS 20%. The odds are 50/50 each year -- like a series of independent coin flips.
3/
Notice that, in any particular year, the *average* (or *expected*) return of B is the SAME as that of A.
That's because, in any year, the *average* of the 2 possible 50/50 outcomes for B (+50% and -20%) is (50 - 20)/2 = +15% -- the SAME as A's steady return.
Notice that, in any particular year, the *average* (or *expected*) return of B is the SAME as that of A.
That's because, in any year, the *average* of the 2 possible 50/50 outcomes for B (+50% and -20%) is (50 - 20)/2 = +15% -- the SAME as A's steady return.
4/
The difference between A and B lies NOT in their *average* return per year, but in the SPREAD of outcomes around this average.
For A, this spread is *zero*. Each year, we get the same +15%.
But for B, the spread is *35%*. Because +50%/-20% is simply 15% +/- 35%.
The difference between A and B lies NOT in their *average* return per year, but in the SPREAD of outcomes around this average.
For A, this spread is *zero*. Each year, we get the same +15%.
But for B, the spread is *35%*. Because +50%/-20% is simply 15% +/- 35%.
5/
So, if we're planning to simply buy and hold one of these stocks for a long time (say, 20 years), we should be pretty much indifferent between A and B, right?
After all, they both have the exact same expected return in every single year.
But that's NOT how volatility works.
So, if we're planning to simply buy and hold one of these stocks for a long time (say, 20 years), we should be pretty much indifferent between A and B, right?
After all, they both have the exact same expected return in every single year.
But that's NOT how volatility works.
6/
To see why, let's do a *probabilistic* analysis.
Suppose both A and B are at $100/share today.
Analyzing A is simple. The stock just rises 15% each year. So, after 20 years, it will be at ~$1,636.65/share.
And if we buy and hold A for these 20 years, our CAGR will be 15%.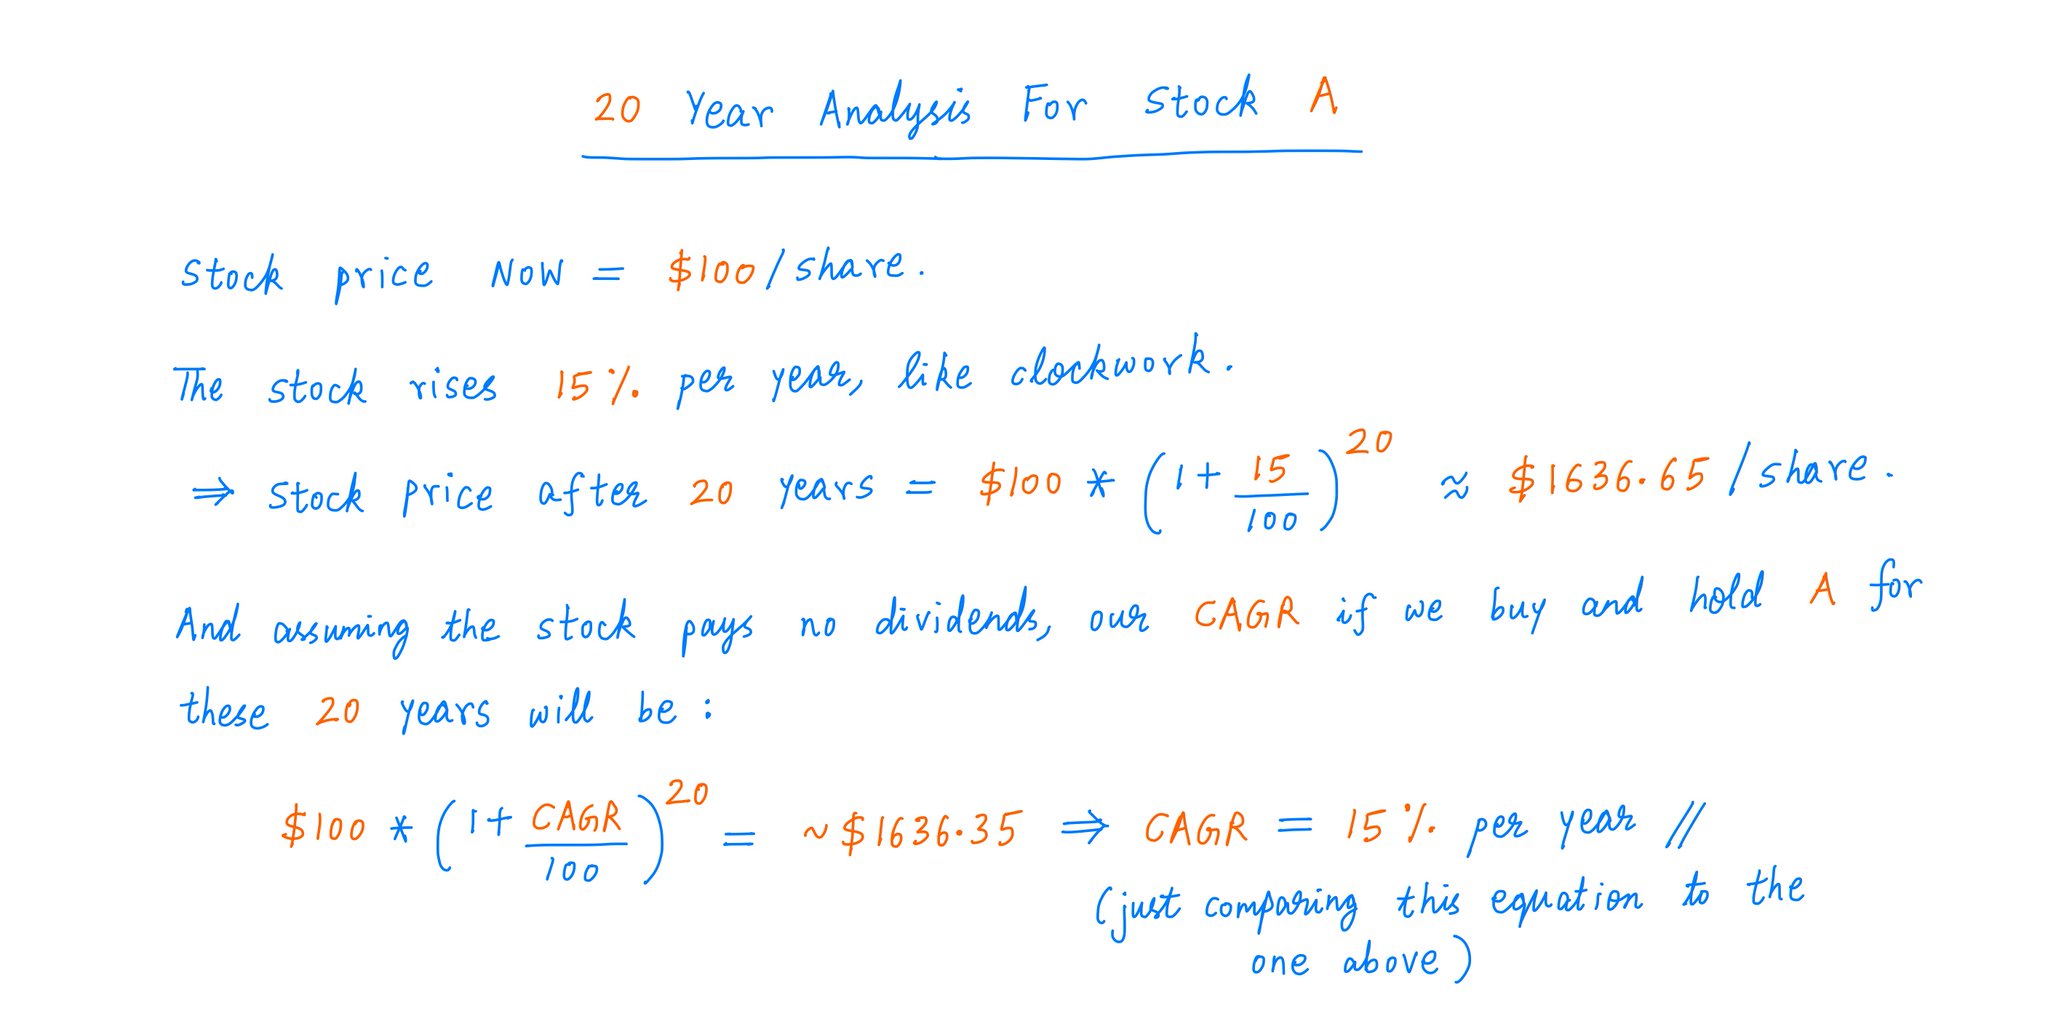
To see why, let's do a *probabilistic* analysis.
Suppose both A and B are at $100/share today.
Analyzing A is simple. The stock just rises 15% each year. So, after 20 years, it will be at ~$1,636.65/share.
And if we buy and hold A for these 20 years, our CAGR will be 15%.

7/
Analyzing B is a little more complicated -- because there are many possible outcomes.
So, let's take this 1 year at a time.
After 1 year of holding B, there are 2 possible outcomes. We could either be UP 50% or DOWN 20%.
Analyzing B is a little more complicated -- because there are many possible outcomes.
So, let's take this 1 year at a time.
After 1 year of holding B, there are 2 possible outcomes. We could either be UP 50% or DOWN 20%.
8/
That leaves us with an *expected* stock price of $115 in a year -- the same as what A's stock price will be at that time.
And after 1 year, our expected CAGR from B will be +15% -- also the same as A's CAGR.
So far, no surprises.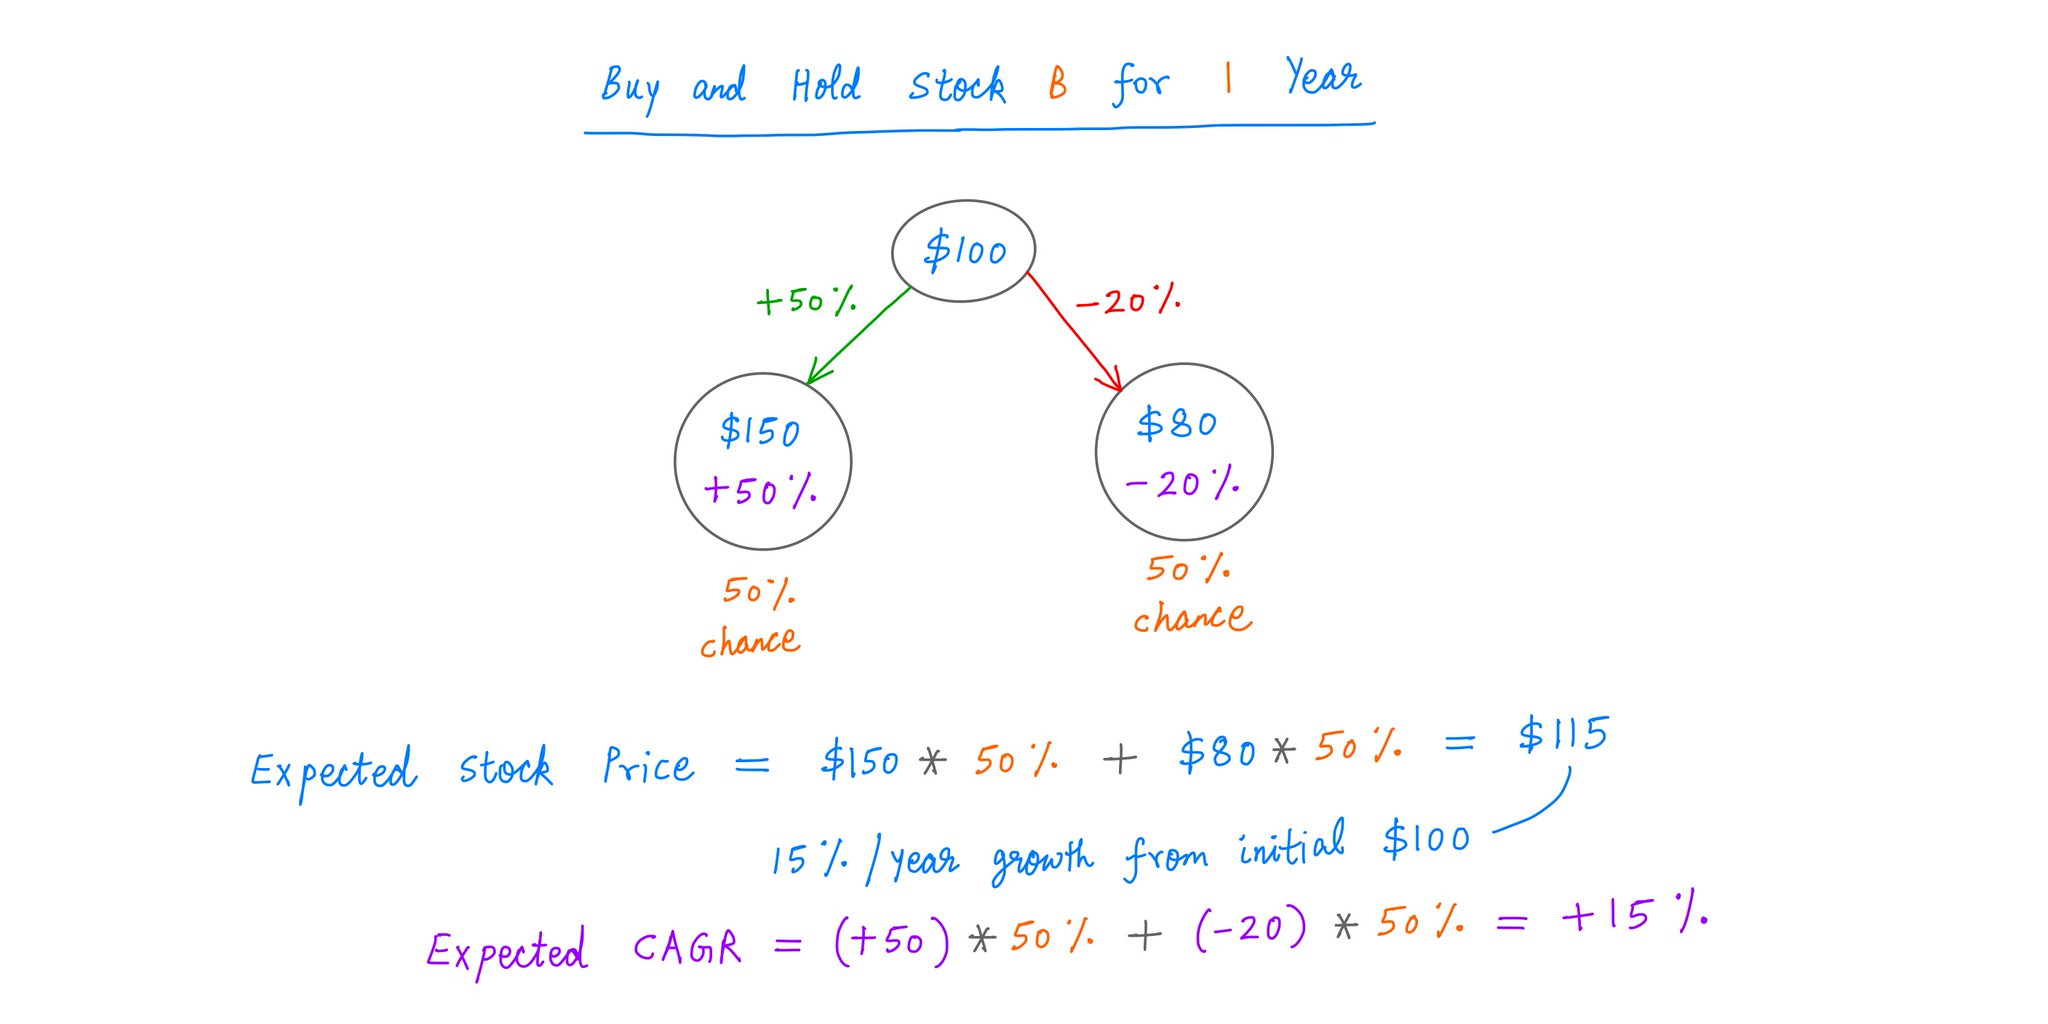
That leaves us with an *expected* stock price of $115 in a year -- the same as what A's stock price will be at that time.
And after 1 year, our expected CAGR from B will be +15% -- also the same as A's CAGR.
So far, no surprises.

9/
What happens when we take this 1 more year forward -- that is, 2 years of buying and holding B?
Now, there are 3 possible outcomes. They're NOT all equally likely.
The *expected* stock price of B after 2 years is $132.25 -- again the SAME as A's stock price after 2 years.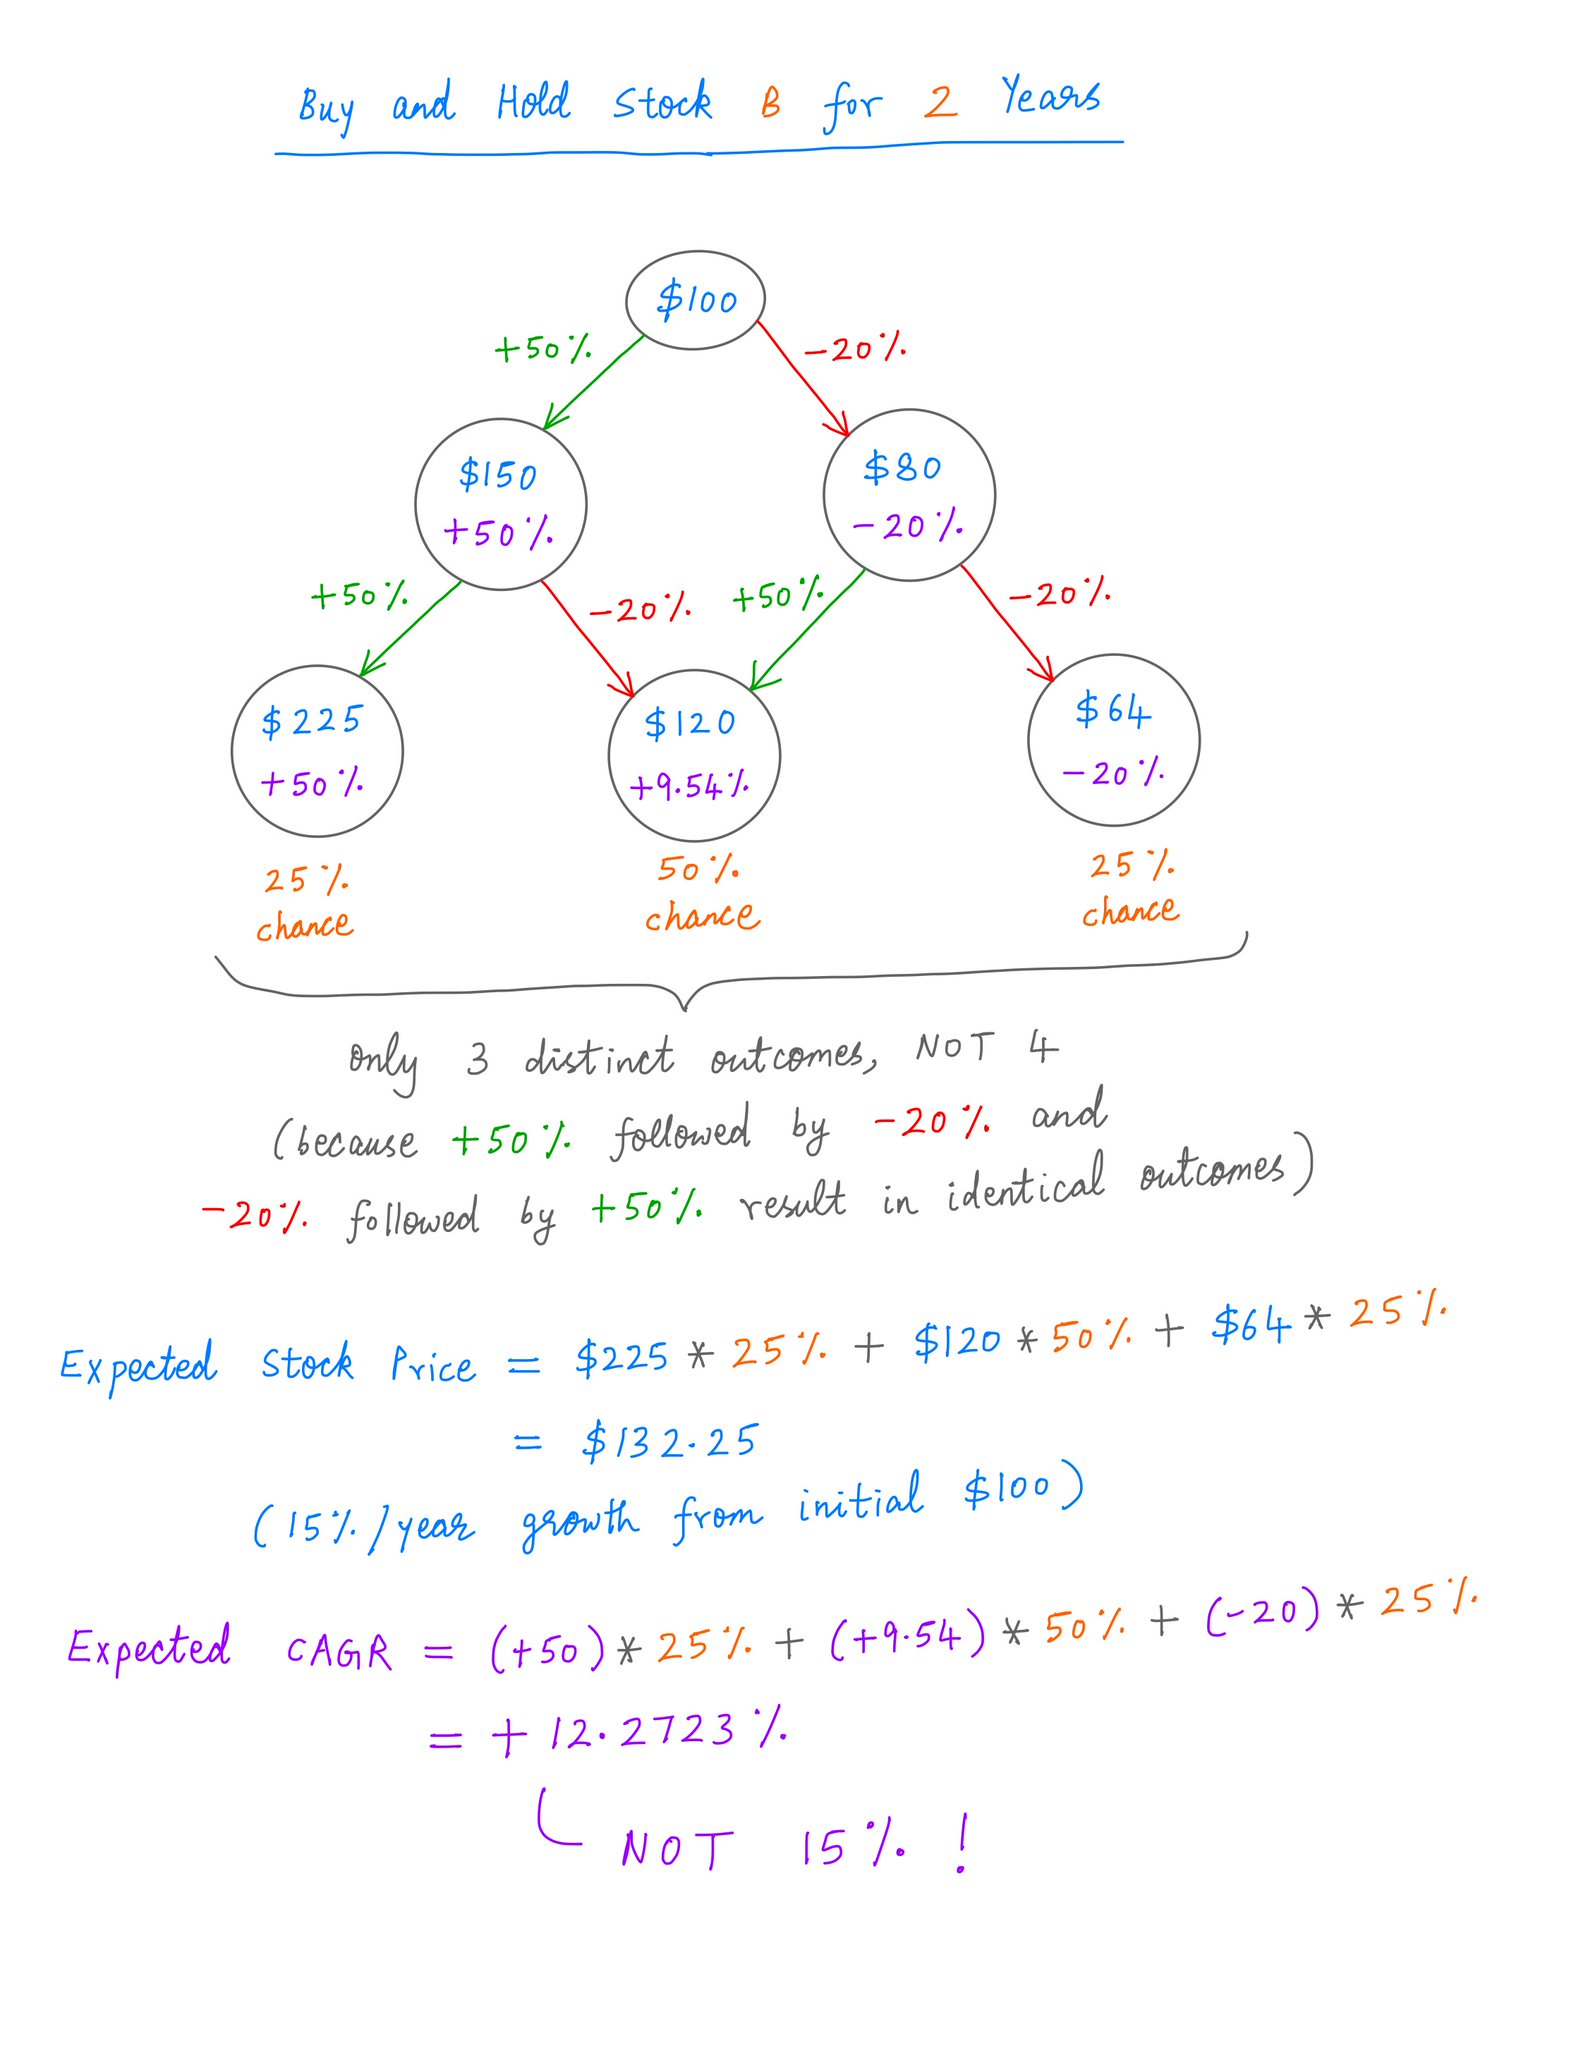
What happens when we take this 1 more year forward -- that is, 2 years of buying and holding B?
Now, there are 3 possible outcomes. They're NOT all equally likely.
The *expected* stock price of B after 2 years is $132.25 -- again the SAME as A's stock price after 2 years.

10/
But here's the interesting thing:
Even though A and B have the SAME expected *stock price*, B's expected 2-year *CAGR* is LOWER than A's.
B has an expected 2-year CAGR of only +12.27%, against A's 15%.
That's the Volatility Tax. HIGHER volatility leads to LOWER CAGR.
But here's the interesting thing:
Even though A and B have the SAME expected *stock price*, B's expected 2-year *CAGR* is LOWER than A's.
B has an expected 2-year CAGR of only +12.27%, against A's 15%.
That's the Volatility Tax. HIGHER volatility leads to LOWER CAGR.
11/
The pattern continues beyond 2 years as well.
For example, when we look 3 years out, B's expected CAGR falls further to ~11.36% -- while A's holds steady at 15%.
And yet, both stocks continue to have the same expected *price* -- $152.09 per share.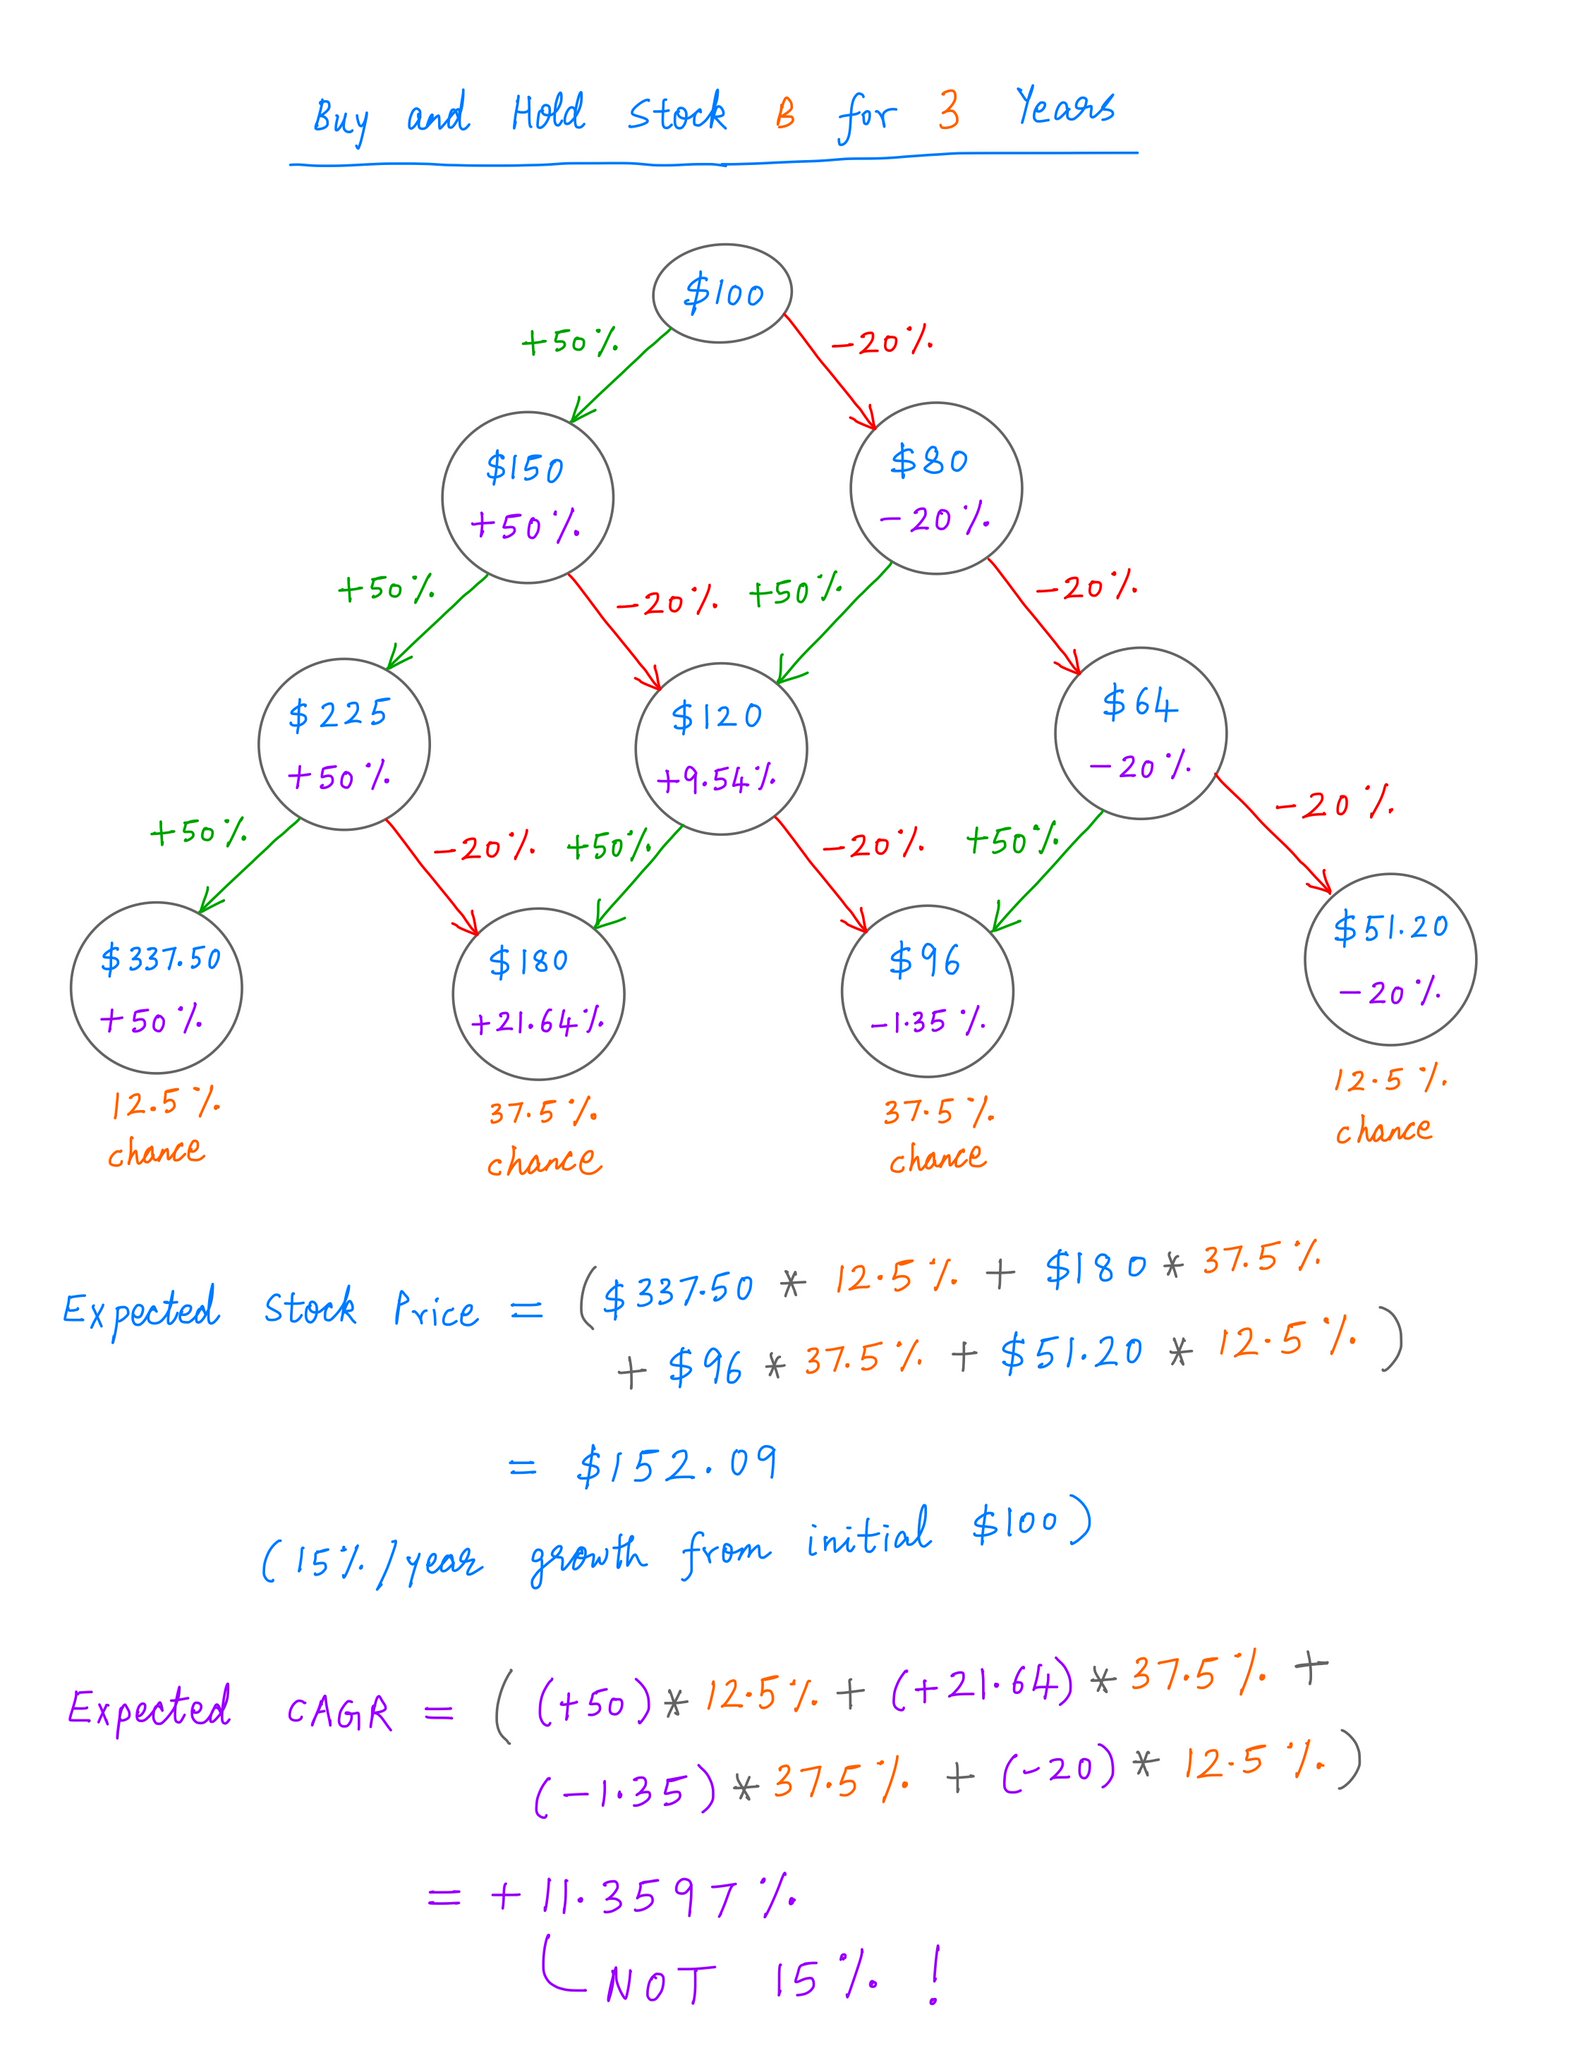
The pattern continues beyond 2 years as well.
For example, when we look 3 years out, B's expected CAGR falls further to ~11.36% -- while A's holds steady at 15%.
And yet, both stocks continue to have the same expected *price* -- $152.09 per share.

12/
No matter how far into the future we go, both A and B will continue to have the SAME expected stock price -- growing at 15% per year.
But while A's expected CAGR will remain at 15%, B's will keep falling -- until it eventually converges to ~9.54%.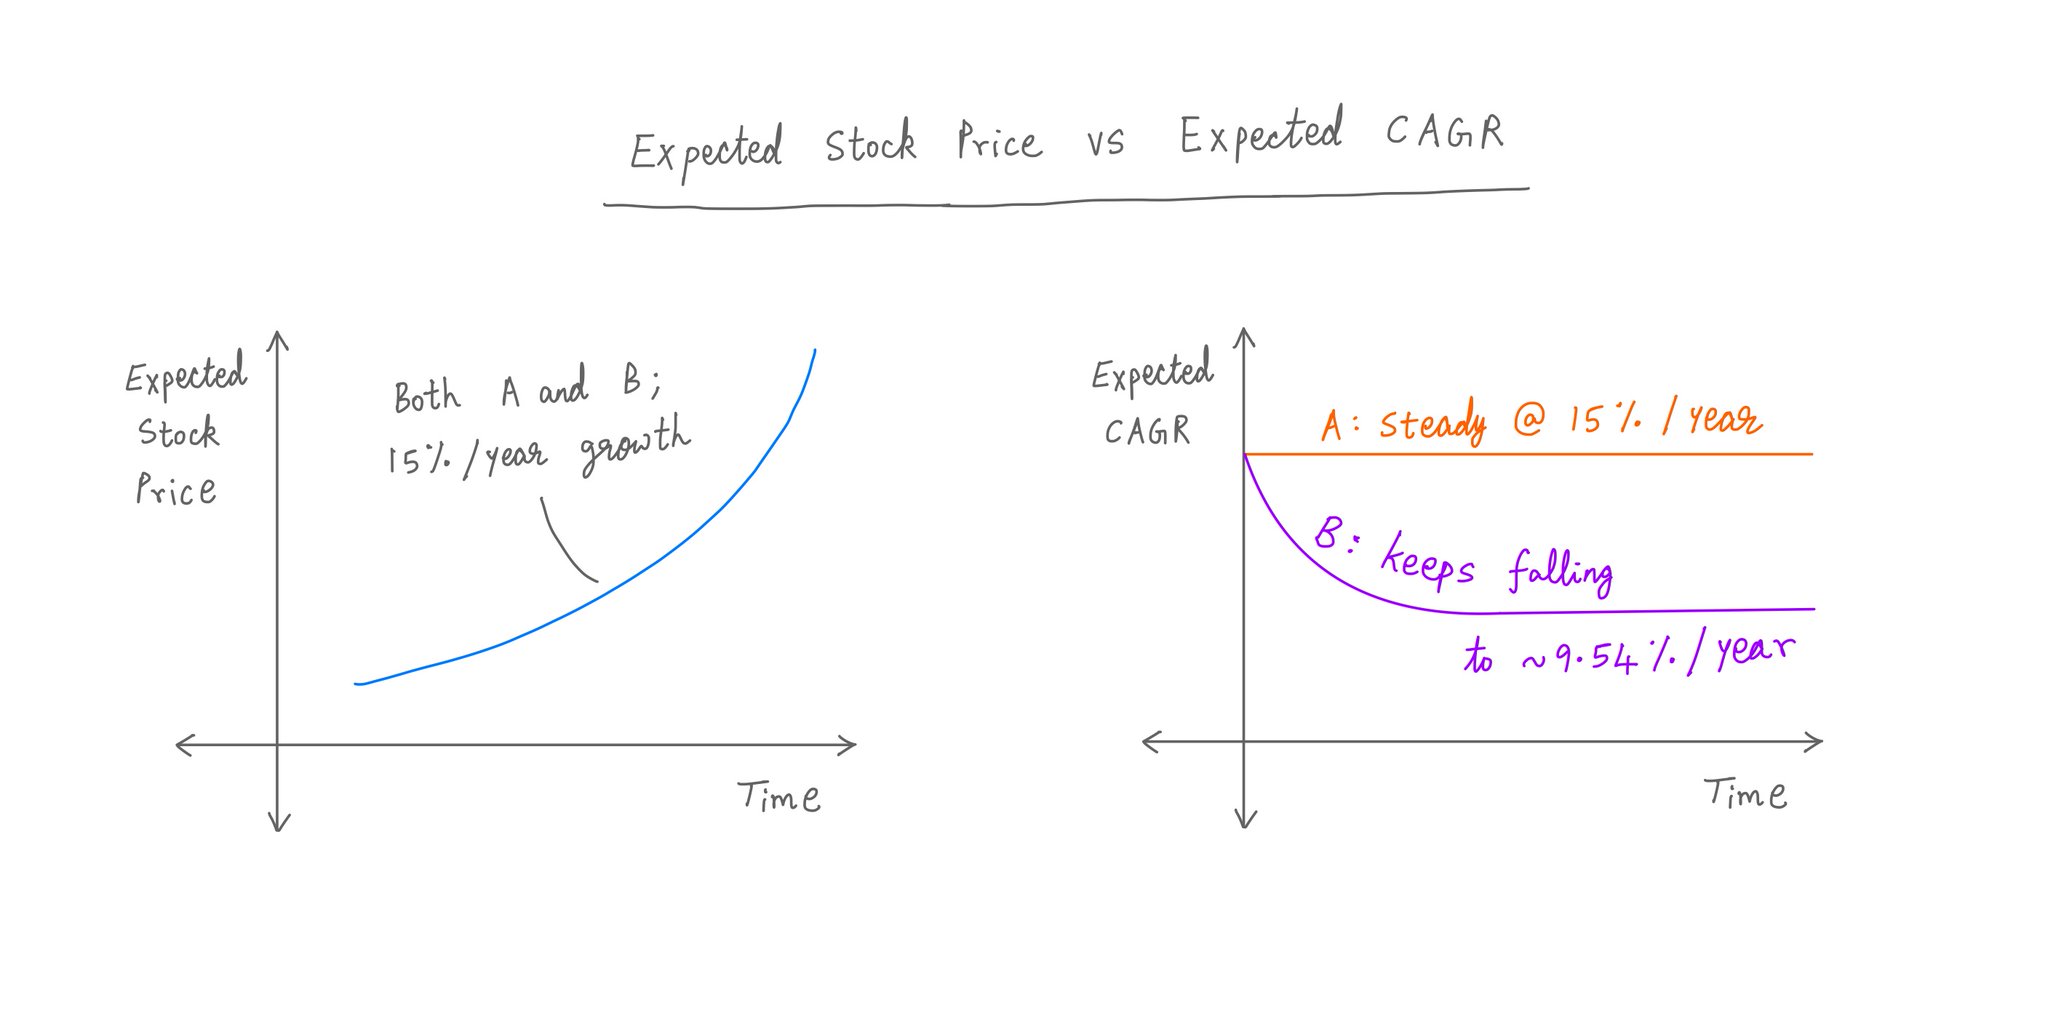
No matter how far into the future we go, both A and B will continue to have the SAME expected stock price -- growing at 15% per year.
But while A's expected CAGR will remain at 15%, B's will keep falling -- until it eventually converges to ~9.54%.

13/
For example, B's 20-year expected CAGR is only ~9.82%.
Why? Where exactly did the remaining 15% - 9.82% = ~5.18% of CAGR go?
Well, that ~5.18% is LOST because of B's *volatility* from year to year. That's the Volatility Tax.
For example, B's 20-year expected CAGR is only ~9.82%.
Why? Where exactly did the remaining 15% - 9.82% = ~5.18% of CAGR go?
Well, that ~5.18% is LOST because of B's *volatility* from year to year. That's the Volatility Tax.
14/
This all seems a bit counter-intuitive.
How can 2 stocks have the SAME expected price, but *different* expected CAGRs?
It's because of *non-linearity*. CAGR is a *non-linear* -- in fact, *concave* -- function of stock price.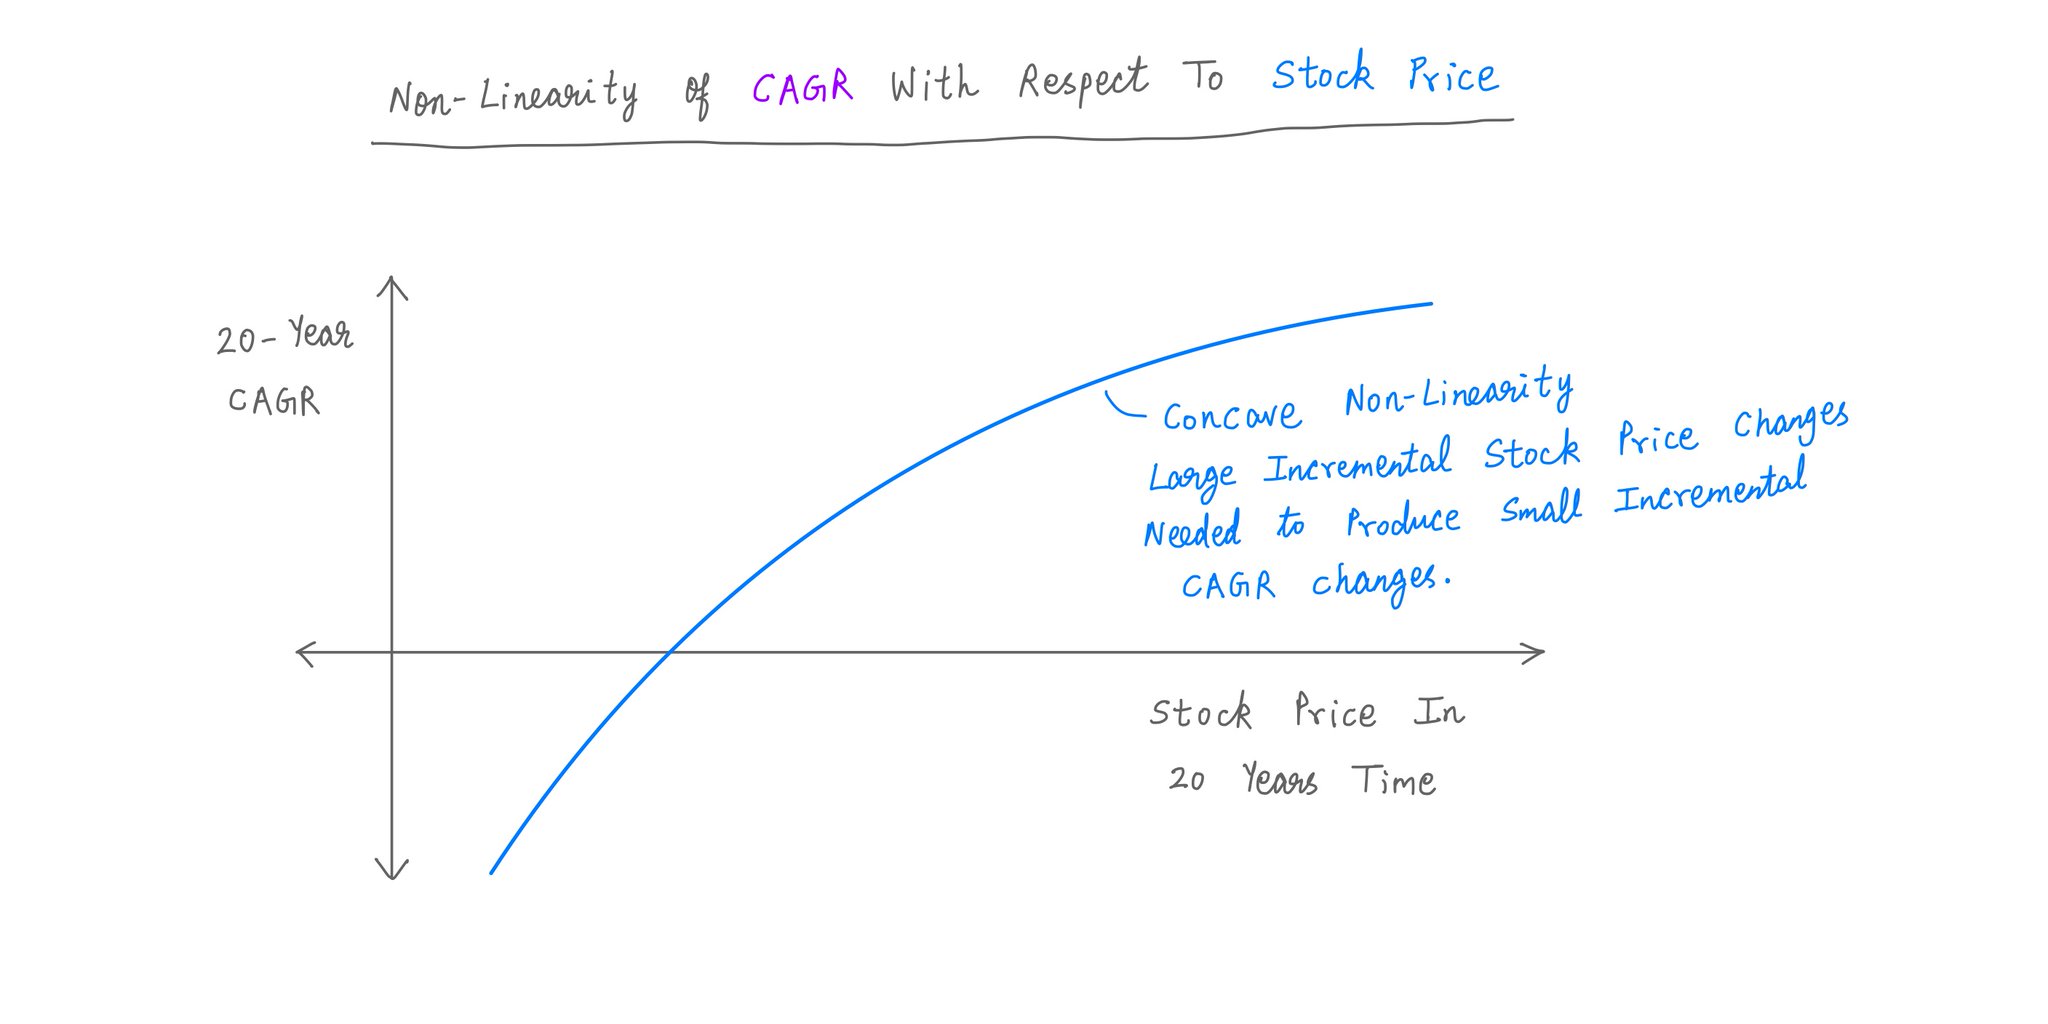
This all seems a bit counter-intuitive.
How can 2 stocks have the SAME expected price, but *different* expected CAGRs?
It's because of *non-linearity*. CAGR is a *non-linear* -- in fact, *concave* -- function of stock price.

15/
And concave functions like CAGR tend NOT to be swayed too much by extreme values of their inputs.
So, even though B's stock price 20 years hence can be as high as ~$332.53K/share, such extremes impact the *stock price* expectation FAR more than the *CAGR* expectation.
And concave functions like CAGR tend NOT to be swayed too much by extreme values of their inputs.
So, even though B's stock price 20 years hence can be as high as ~$332.53K/share, such extremes impact the *stock price* expectation FAR more than the *CAGR* expectation.
Mentions
See All
Jim OShaughnessy @JimOShaughnessy
·
Jan 9, 2022
Another great piece from @10kdiver on the volatility tax. There's another "tax" he doesn't mention explicitly, which is the emotional reaction many investors have to volatility--which often leads to emotional selling when downside volatility is reaching its maximum.