Why mobile speed is lower on Google Page Speed Insights results than on the actual device

As soon as the front end of a web app is completed, the developers, product owners, project managers, etc rush to Google PageSpeed Insights to gauge the site performance. This is obvious: why a customer will use a slowly loading site? Even Google is said to be penalizing slow sites in SEO. The stakes are high.
But, when audit results are unexpectedly low, the plans and strategies are envisioned to fix it. To add insult to injury, mobile mode usually performs half that of desktop ones. But, there is a silver lining: it’s not your fault predominantly. Let’s dig into how is this mobile ranking system broken.
What is Google PageSpeed Insights?
PageSpeed Insights (PSI) reports page speed on both mobile and desktop modes. It provides field data and lab data under predefined criteria for core web vitals and suggests changes to improve site performance.
Under the hood, it uses the Lighthouse, which is an open-source and automated tool aimed at auditing web pages against various page speed metrics, including performance, accessibility, progressive web apps, and more.
Lighthouse audits a site in three sections:
- Suggestions for improvements against each metric to load faster.
- Diagnosis and provide information as to how to use best practices.
- The indicators which have been passed and their scores.
Metrics building up site/page speed score
Six factors determine page speed score and each constitutes a different percentage.
+--------------------------+--------+
|          Audit           | Weight |
+--------------------------+--------+
| First Contentful Paint   | 10%    |
| Speed Index              | 10%    |
| Largest Contentful Paint | 25%    |
| Time to Interactive      | 10%    |
| Total Blocking Time      | 30%    |
| Cumulative Layout Shift  | 15%    |
+--------------------------+--------+
How does Google Page Speed Insights work? And Why are mobile scores poor?
Google Page Speed Insights estimates site speed scores against Desktop and Mobile screens. But, a wide gap is obvious between results even same internet connection is used as a mobile screen will achieve lower than the desktop one.
Let’s understand how mobile audit works.
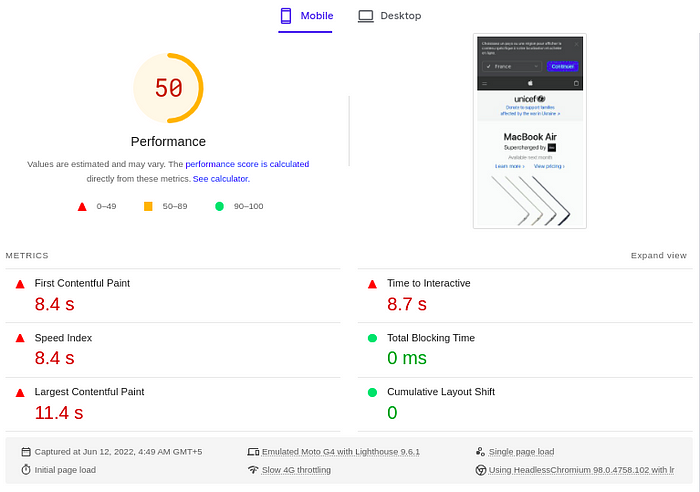
Google LightHouse and PageSpeed Insights use a slower device and 4G connection.

Google uses Moto G4 released in May 2016 to load the webpage with a slow 4G (faster 3G) connection. It means a modern interactive web app built in 2022 will not only be tested on a six-year-old mobile device but also a slower internet connection. The result is the slow loading of the web app.
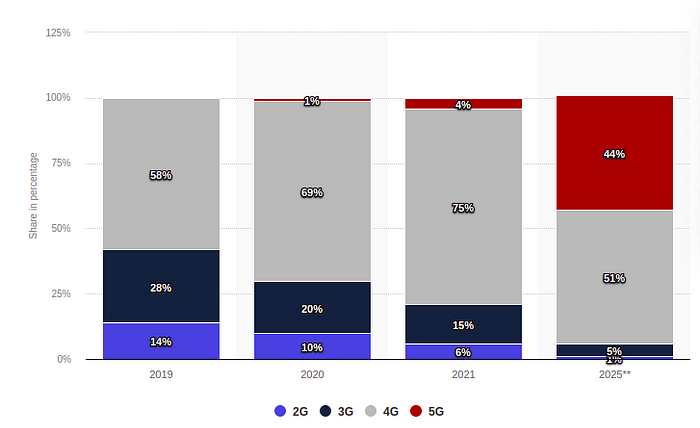
Do your targeted customers still use 3G connections?
As Google has set slower 4G an internet speed benchmark for measuring site speed, a comparison is drawn between real 4G and3G users.
It is pertinent to find out if a great majority of users are going to use slow 4G connections. As per Statista.com, in the USA, 347.7 million users will be using faster connections as compared to 16.8 million opting for 3G connectivity.

The same goes for the EU, where 79% of customers pay for 4G and 5G internet compared to 21 for slower 3G and 2G.
Then why does Google use a slower device and internet connection?
An explainer will be that Google wants to make the website accessible to all users irrespective of their devices and internet connections.
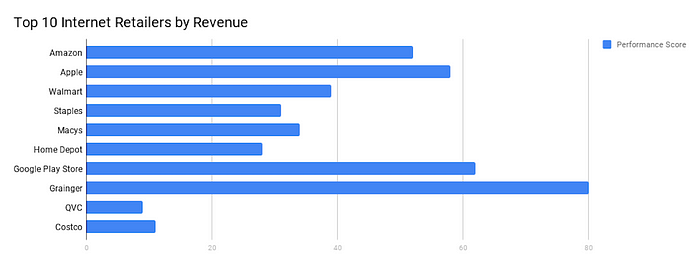
How much do the web/eCommerce giants rate on page speed?
Layer0 conducted a study and found out that the top 100 e-commerce websites scored an average of 25.9% on mobile screens. So, you are not alone.
Making sense of how PSI is faulty.
Stimulating page load on an outdated mobile device with a slower connection does not make sense. Modern web apps have become more interactive and are loaded with tons of JavaScript and other libraries. To process and execute this tech requires heavy computation memory, which is fortunately provided by the latest mobile devices. In the same fashion, to download that JS and other code in the browser, 4G and 5G connections are enough.
But, in the case of Lighthouse and PSI, both dependencies are years old. As a result, a frontend built to run efficiently on commonly used mobile phones performs badly on older devices and gives a bad site speed score. It’s like blaming the GTA V game for not being running on Intel’s Pentium 4 computers.
Solution: Chrome UX Report gives real device speed scores.
What is Chrome UX Report?
The Chrome User Experience Report, powered by real user measurement of key user experience metrics across the public web aggregated from users, gives low-latency access to aggregated Real User Metrics (RUM).
An important thing to note is that a few metrics change in the CRUX report. But, the auditing factors behind the metrics are more or less the same with a similar general understanding.
The Chrome User Experience Report is provided as a public project on Google BigQuery.
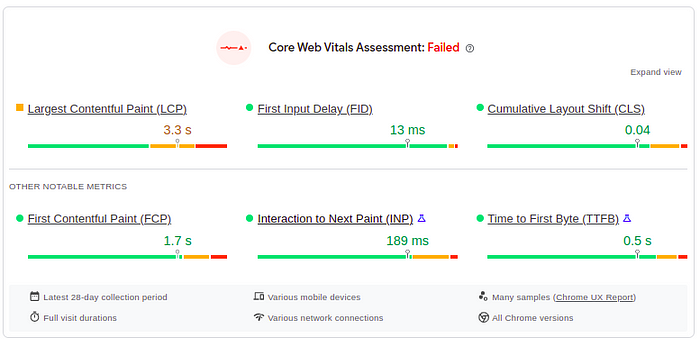
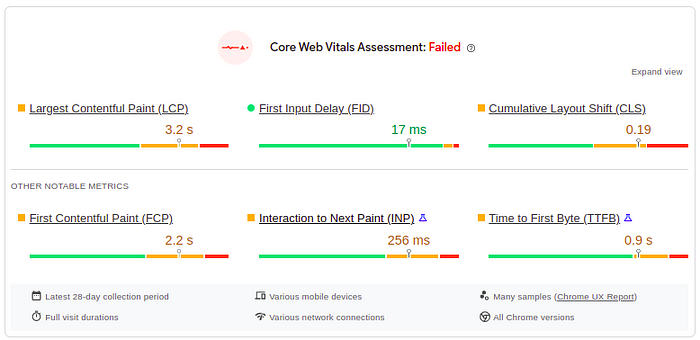
I measured and compared some top websites which show discrepancies between PSI and CRUX score on mobile devices.
The metrics on CRUX Reports indicate much better performance with none of the audits in the red zone. However, the PSI on a slow device generates a report with four indicators in the alarm. what a difference.
2. Youtube.com
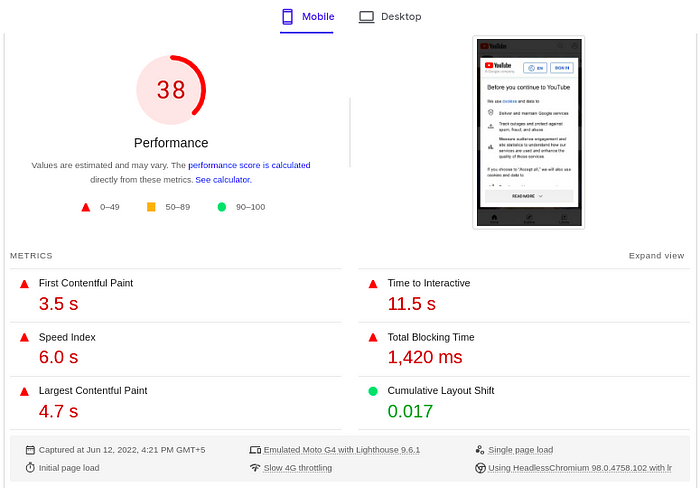
The Pagespeed Insight results substantiate the notion that testing on Moto G4 and slow 4G is outdated in 2022.
Are there still prospects to enhance the site rate by utilizing PSI?
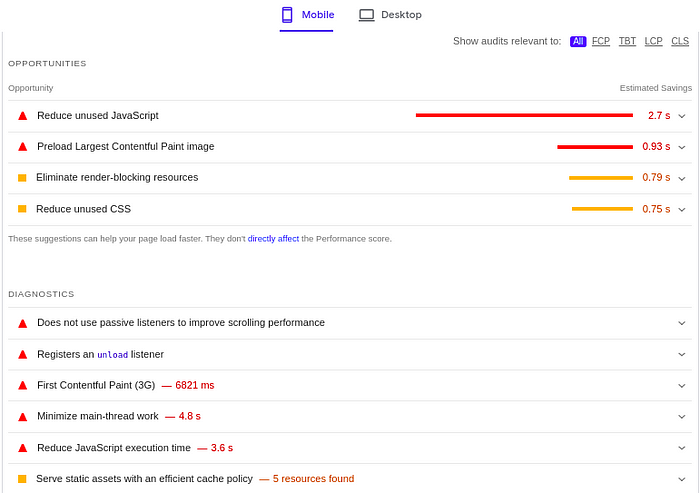
Yes. The diagnosis and opportunities features of PSI are indeed worthwhile for improvements. Metrics, where progress is needed, are pointed out with valuable suggestions. Fixing those certainly ensures faster loading and score.
For example, it guides and proposes exactly where and what modifications are required to optimize. These suggestions range from JavaScript to CSS files. Even often changing image format to load them faster comes as a handy tip.
Remember one thing: You should aim for eliminating all red and yellow zones from your site speed results.
What are some other solutions to test page speed?
Conclusion
Google PageSpeed Insights is not the optimal solution to test your site performance on obvious grounds. The majority of websites fail the benchmark when tested on older devices. However, Chrome UX Report is a better alternative as you can check the performance and experiences on real users' devices.
Follow for more amazing content.
Let’s connect on LinkedIn and Twitter.
Thanks.