
Global venture ecosystems are deep in the fundraising desert.
- Our “Weather Report” measures the supply of Venture Capital relative to the demand. Our indicator suggests we are about 1/3 of the way through the desert, where we expect maximum restructuring (strategy, capital, and talent) to hit in 12-18 months.
- We estimate that there is currently an annualized funding deficit of $100B+ in USA Series A-C, and roughly 5x that figure globally.
- Fewer founders will fail than you think, even with a massive shortage of capital that dwarfs any in the past. In fact history would tell you that typically failure rates only increase 4-5% from typical levels.
Let’s take a look at the supply and demand of VC funding.
In the second half of 2022, there was a strange puzzle to reconcile in global Venture Capital ecosystems. On one hand, VCs and founders widely acknowledged a degrading fundraising environment in which companies needed to significantly downgrade their fundraising expectations. On the other hand, it was widely acknowledged that there was more VC dry powder than ever before. Are these two not directly contradictory? Was one side wrong?
We learned that these can both be true. Indeed there is more VC funding available than ever, but the demand for that capital has grown even more rapidly. That is, the supply of capital grew, but demand exploded. This led us to create a gauge that measures the relative availability of capital, which we call the Weather Report. This gauge measures
[how much investment actually occurred]
in each ecosystem relative to
[how much investment would have occurred under normal market conditions]
For example, we can analyze the expected demand for capital at the Series A stage by analyzing who raised Seed capital in the recent past, and analogously for the demand for capital at Series B, C and so on.
The record deficit of VC funding keeps expanding.
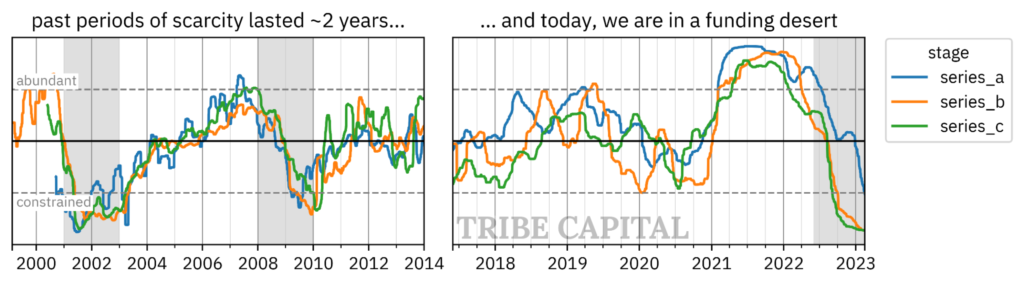
In our original report from November 2022, conditions had begun degrading. At that time, the most notable characteristic was going from an abundance of capital to a period of moderate scarcity. Today, Venture funding has become even more scarce and appears as scarce as it was during the “Dot Com Bust”. By our estimates, we are about 1/3 of the way into the fundraising desert, where maximum restructuring will be prevalent in global VC ecosystems over the next 12-18 months. This can be seen in our USA Series A-C weather gauges in the chart below.
In our opinion, this time is different because Venture markets are larger and more advanced than they have ever been. While the relative scarcity of capital has been comparably large in the most extreme funding environments of the past, the objective dollar amount of funding shortage has no prior analogy. The driving force that caused the demand momentum was the record abundance of capital from the second half of 2020 to the first half of 2022.
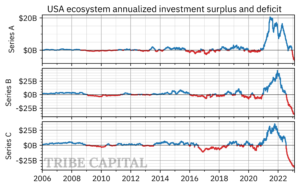
Below we show the surplus (positive, blue) and deficit (negative, red) of funding for the USA Series A-C ecosystem. The surplus and deficit is estimated from the amount of funding one would expect to see at the Series A stage if Seed Stage companies raised normal amounts on a normal schedule. When the actual amount raised is in excess of the normal expected amount, we see a surplus, and vice versa. These are the primary inputs to the weather gauge. Among the USA Series A-C stages alone, we estimate an excess of $100B deficit today, and 3-5x that figure globally. That is, today we’re observing about $35B of annualized investment at the USA Series A-C, and if demand were being met we would have expected to see about $125-140B.
Global ecosystems are dry and very correlated today.
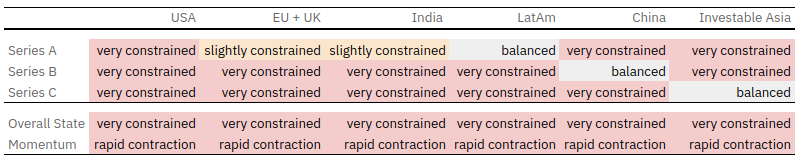
In the table below we share a summary of Tribe’s Weather Gauge for select stages and large venture ecosystems. In this table, the Overall State indicates a blended gauge across investment stages, while the Momentum indicates the direction and magnitude of the change of the Overall State over the past 12 months. Summarizing …
- Every major ecosystem is experiencing “very constrained” capital conditions.
- Every major ecosystem has experienced “rapid contraction” relative to January 2022 in that the reversal to their current state happened quickly.
- Mid- and late-stage venture investment is more constrained than earlier-stage investment today
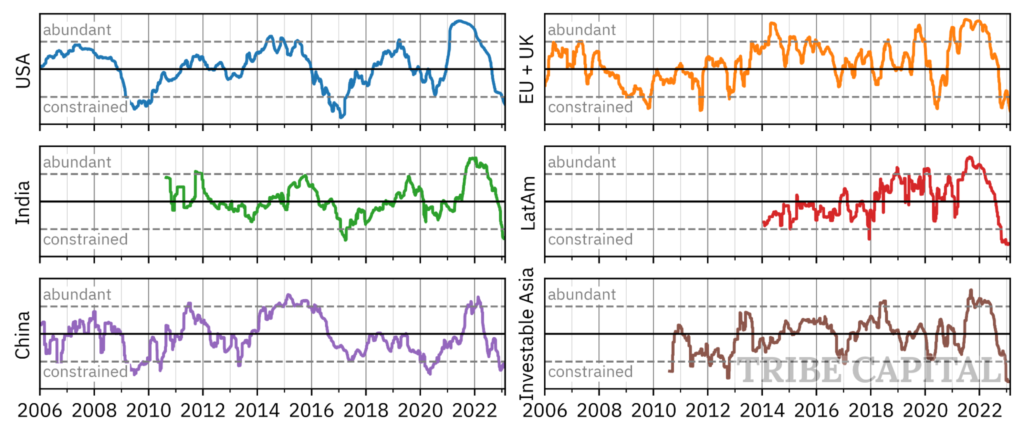
By integrating the multistage indicators for each ecosystem we can produce an aggregate ecosystem-level Weather Report shown below. Furthermore, all ecosystems are experiencing significant relative capital scarcity.
The silver lining is that most founders will cross the desert.
When a startup gets funded, there are 3 general final outcomes:
- they have a low-to-flat exit, 0.5-2x,
- they have a great outcome like an IPO, or
- they go out of business.
Measuring these fates is quite challenging, especially since knowing the results can take a decade or more, and we elaborate on our approach more in the appendix. While there are many variants of the death rate, and they will have different objective levels, the important feature here, which we have written about, is that the death rate is relatively insensitive to funding deserts. By our estimates, for every 10 companies that would succeed in normal times, about 9 will succeed in tough times.
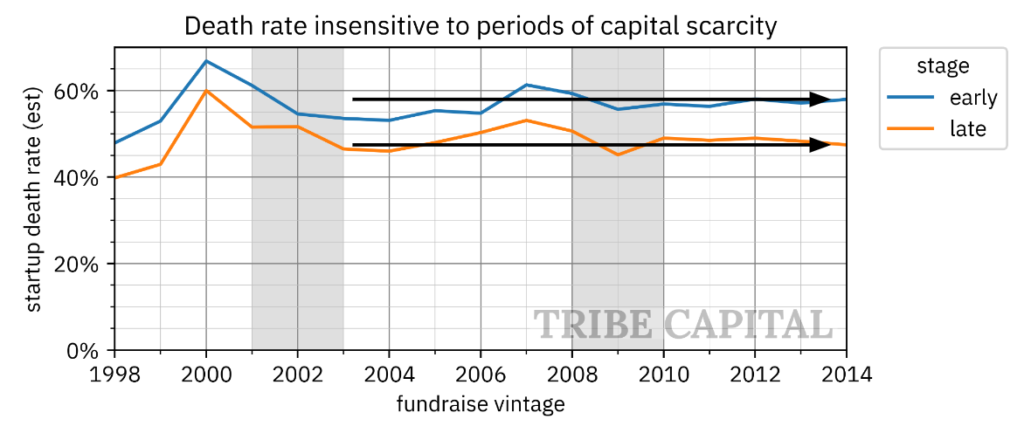
Conventional wisdom is that companies raise a lot of money during periods of excess, overhire, and then lose momentum and close their doors. As a result, one would expect the rounds preceding the desert to therefore have higher failure rates, because they fail to satisfy the capital needs of their business, which becomes predicated on vast amounts of capital. However, history would tell you that this is false, because failure rates only increased by 4-5% from their typical levels preceding downturns. While this effect may have appeared higher before the “Dotcom Bust,” it is hard to be sure because data is less complete at that time and therefore has higher variance.
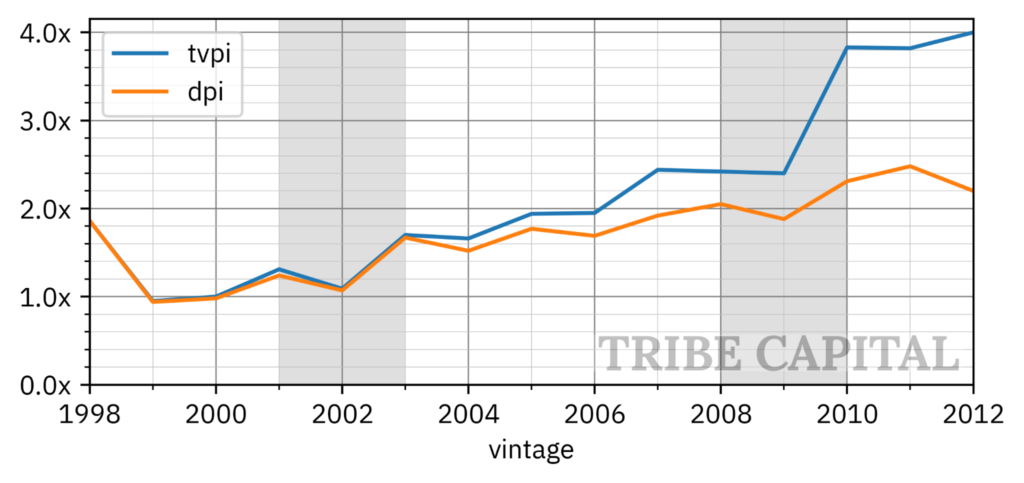
When we consider fund performance, we see a similar effect, where funds closed and deployed over the years preceding the 2008 “Great Financial Crisis” appear to have been largely unaffected by the desert and instead follow the long-term secular asset class trends. However, there does appear to be some drop from 1998 to 1999 fund performance. But the prevailing story there, in our eyes, was the favorable exit environment of 2000 boosting 1995-1998 fund performance rather than the funding desert of 2001-2003 impeding performance.
This is a reminder that Venture is a long game, and financial shocks, even those that last a few years, are transient. In general, funds are deployed over 3 years, and are managed over 10 years. Entrepreneurs often have a 10+ year journey seeing their visions through to completion. These financial shocks may affect the short term decision making around fund pacing, hiring, and so forth, and also are reflected by large changes in funding behavior and activity, but in the end they are often passing events in far longer arcs.
The ecosystem restructures during changing paradigms.
While we believe that roughly the same number of startups will succeed through the desert as in normal times, we don’t mean to imply that they’ll be operated the same through the different paradigms. To accommodate the change in environment there will be a restructuring. When we say restructuring, we are talking about the broad ecosystem of LPs, Venture Funds, and Startups. Further, because winning strategies vary based on the paradigm, restructuring often happens in Venture on the way up, such as late 2020 to early 2022, and on the way into the desert, such as is happening today.
During the tail end of the last paradigm, from late 2020 to early 2022, there was a flood of liquidity into Venture globally, driven by low-interest rates and fiscal and monetary policy that drove up the value of traditional real estate, debt, and equity markets, pricing down future yields and making them appear relatively less attractive than private markets. As a result, there was a massive flow of capital into Venture. This was expressed as a significant influx of capital from “Fast Money” transactional market participants in addition to increased allocation from long-term “Slow Money” market participants. This “Fast Money / Slow Money” effect is described in our previous work. Combined, this drove the Venture industry to restructure, characterized by:
- Capital restructuring: more liquidity drove prices and marks up, creating a flywheel effect to drive more capital into venture.
- Access to capital as a “win” vector: one of the most defining “win” vectors for companies became access to capital, and the ability to “land grab” markets and suck up all of the oxygen from any competitors.
- Focus on growth at all costs: as such, many startups restructured toward “growth at all costs.”
- Fundraising: Venture investors raised larger funds and had more aggressive pacing to align themselves with this new paradigm.
- Cap table restructuring: with the supply of capital in excess of the demand, cap tables restructured in terms of mix of market participants, looser governance, rapid deal turnover (“are you in or out”), and overall less aggressive benefits to preferred stockholders.
The level of risk in venture and how much the intrinsic value of a company is dependent on distant-future performance, compounded with how the availability of liquidity can affect the odds of success, often make the capital markets of Venture extremely sensitive to interest rates and liquidity. As traditional markets experienced a correction, a general restructuring for all Venture participants began and is presently unfolding:
- Allocation shifts: many LPs suddenly found themselves “overexposed” to venture, or were in sudden need of liquidity, making illiquid assets unattractive and driving even more outflow, restructuring the availability of capital from abundant to scarce. The largest pullback is from transactional “Fast Money” Venture LPs.
- Venture investor reposturing: Venture investors have become price setters instead of price takers and are willing to wait, and are also ready to defend existing positions.
- Founders restructure their operations: founders, who disagree with the prices offered, prefer not to transact and instead restructure their operations to be in stronger positions for when they go to market for capital, through “reductions in force” and an emphasis on burn and efficiency.
- Deal complexity: a proliferation of recapitalizations, more aggressive liquidity preference, secondaries, and wider use of Venture debt, to name a few. As a result, cap tables are seen to be restructuring toward longer-term partners and generally lower valuations.
It’s important to note that restructuring in good times is not worse or better than during tough times. We believe it is more a question about how to restructure and align execution along with the broader paradigm since it takes a different approach to win in different paradigms. In our opinion, a natural continuation of this reasoning is that what it takes to win in some paradigms benefits some founders and investors more than others, depending on their edge. This is one insight as to why death rates are insensitive because when some companies are repositioned from favored to disfavored, other companies reposition from disfavored to favored if their edge in the new paradigm, such as execution efficiency, which could hurt during an exuberant paradigm but be to their great advantage in the desert.
We’re a venture capital firm focused on recognizing and amplifying early stage product-market fit. Reach us at hello@tribecap.co.
Appendix: FAQ
What is a fundraising desert, and what is not?
We consider a fundraising desert as a long period of time, typically two years or even longer, where venture fundraising activity is low relative to demand. Defined equivalently, this is a 2+ year period where the Weather Report is “very constrained / scarce”. Fundraising deserts often form in multiple ecosystems at a time, and sometimes they form in every major ecosystem. The primary example from the past was the Great Financial Crisis where there was a period of deteriorating capital conditions in every major venture market that we can measure from roughly 2008 to 2010.
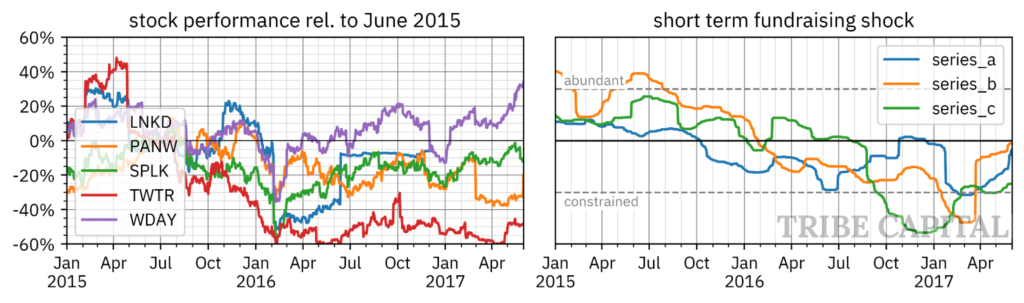
Two non-examples of fundraising deserts are the 2016 tech scare, and the beginning of COVID in 2020. These were periods of roughly 6 months where there were short term shocks to venture markets, but they reverted back to normal conditions. We’ll expound on these examples in the USA ecosystem because we believe it is representative of the short term fundraising action observed in other ecosystems at those same times.
The 2016 shock shown for the USA market is a good example, in our opinion. In Early 2016, many high-growth, venture-backed tech companies experienced significant sell-offs. For example, Linkedin (LNKD) lost 77% of its value on February 2, 2016. More recently IPO’d companies like Palo Alto Networks (PANW) also had major drawdowns in early 2016 (below figure, left). There was a reverberation in venture markets, especially later stage markets, indicated by a 3-6 month period of slower fundraising activity indicated a few months later in the Weather Report (below figure, right).
If fundraising slows down does that mean demand drops?
A common misconception is that decreased activity in venture means that demand has dropped. In fact, our research shows that it is just the opposite: when fundraising falls short of expected demand, it means that the supply has dropped. We have found that the slowdown in activity during conditions where we would normally expect higher levels of fundraising to occur is consistent with demand not being met and a scarce or constrained Weather Report.
How did you define each of the global ecosystems?
We determined Venture ecosystems largely geographically and determined country inclusion based on total activity by including the countries that concentrate the vast majority of activity in each respective ecosystem. Note that these ecosystems are based on where companies are headquartered and not based on where the participating investors are located. The specific countries we included in this analysis are listed below, but we want to emphasize that this is not a static classification and might evolve in the future:
- “USA” included the USA and Canada.
- “EU + UK” included the UK, France, Germany, Spain, Netherlands, Denmark, Switzerland, Italy and Belgium.
- “LatAm” included Mexico, Brazil, Colombia, Argentina and Chile.
- “Investable Asia” included Singapore, Indonesia, Korea, Japan, Hong Kong and Taiwan.
- “India” and “China” included just India and China, respectively.
We acknowledge that this is not a totally complete list. There are countries many could argue belong in those ecosystems, though our classification does represent the vast majority of the fundraising activity in those ecosystems and therefore we believe the ecosystem-level Weather Reports will be largely unaffected by the addition of other long-tail countries.
Some other ecosystems, such as MENA (Middle East and North Africa), are on our radar. These ecosystems are either smaller or considered less developed than the largest ecosystems mentioned above, meaning our measurements lack history or precision. We will include additional ecosystems when there is enough data and history for our measurements.
Can you elaborate on the details of how the Weather Gauge is computed?
The core insight behind the Weather Report is that the abundance and scarcity of capital is indicated by the relative balance of the supply and demand of capital as compared to what their base levels are across fundraising environments.
Measuring the demand side is conceptually simple, and is indicated by answering “if companies raised round N in [1] a typical timeframe and [2] in typical volume at [3] typical failure rates, how much money would we expect to see at round N+1?” So, for the sake of example, the Series B demand gauge is proxied by answering [1] two years ago, for past Series A investments, [2] at about 2x the round size of their Series A where [3] Series A-funded companies go stale ~ 30% of the time, how much fundraising would be occurring today? While the parameters indicated in [1-3] are determined dynamically in our proprietary time series analysis, this is the essence of how we measure the demand side.
Measuring the supply side is conceptually more challenging but technically simpler. Because answering the counterpart question “if funds deployed their typical amounts on typical timeframes” depends on significantly lagged and less complete information about fund sizes, we instead create a practical definition of supply which is “how much fundraising actually happened?” The reason we adopt this approach is because it will be directionally equal to the movement in supply insofar as changes in the supply curve, given the correct definition of the demand above, will be, to first order, equal to the clearing volume of fundraising. Because we normalize all of our data in our time series analysis, the constant prefactor related to the supply curve has no influence on the measurement.
We then finally determine, using these inputs, “how much demand is there relative to the actual fundraising, how does that vary relative to what is typically observed over history, and where are we today relative to typical variance?“ for every major Venture ecosystem and relevant stage of fundraising.
How did you measure the death rate?
Before we discuss failure / death rates for different startup stages, we want to caveat that the concept we are investigating is the effect of fundraising deserts on company outcomes. There are many different ways to ask this question, such as looking at other milestone behavior like propensity to make it through the desert and raise another round of capital. There are even multiple definitions of “fail” – which could mean outright death, any exit below 1-2x since the majority of venture returns are driven by outlier breakout companies, and so on. So, we want to emphasize that this is one of many ways you could measure the effect of a fundraising desert on company outcomes, and it is even one of many ways of measuring whether a company failed. This is why we also provided DPI and TVPI information. We also want to emphasize that we have explored many of these various definitions and the story in the context of what matters to us here (the effect of a period of low fundraising activity on company performance) leads us to the same conclusion: fundraising deserts have a small effect on outcomes.
With this said, we’ll share our measurement of company failure rates. To start, after a company raises money there are 3 possible “next state” events that can occur:
- they raise more money, or one of the three exit scenarios which mean
- They have some exit, which could be a flat outcome (0.5-2x) or a great outcome like an IPO, or
- they go out of business.
This measurement is quite nuanced and difficult. For example, even 6 years after a fundraising event only roughly 75% of company outcomes are known. Further, measuring death is extraordinarily hard and amounts to measuring the absence of a next event, but how long should we wait? To make this even harder, event (1) is not an outcome, but a recursive retry at any of the outcome scenarios (2) or (3).
We proceed by breaking this estimate up into two parts:
- The next event outcome
- The steady state transition matrix
This is represented by the following Absorbing Markov Process
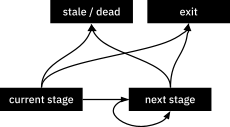
The reason the “next stage” is recursive is because, to first order, this base rate will capture the scenario of surviving in average conditions at different scales the company will traverse. Here, we used a 10 year horizon to determine if a company is stale, which means no liquidity or fundraising after a 10 year period. Because this covers 90% of cases, the subsequent recursive “next-stage” matrix captures the remaining 10% effect to first order, producing an error which becomes precise enough to be limited by the correctness of the raw source data.
This process is represented by the following transition matrix
\[P = \begin{pmatrix}Q & R \\ 0 & I\end{pmatrix}\]Where I is the identity matrix, and
\[Q = \begin{pmatrix}0 & f_1 \\ 0 & f_2\end{pmatrix}\] \[R = \begin{pmatrix}d1 & e_1 \\ d2 & e_2\end{pmatrix}\]Hence Q is the transition matrix between transient states, and R is the transition matrix from transient states to terminal states. Here the transition probabilities f represent the probability of a next fundraise, and the outcome variables d, e represent the death probability and the exit probability, respectively, and are the terminal states. Row 1 indicates we start in our current state, and is subscripted with 1, and row 2 is the recursive fundraising state until exit, and represented with the 2 subscript. Using standard approaches to absorbing markov chains, the absorbing probabilities are the first row from the matrix produced by computing
\[(I-Q)^{-1}R\]Legal Notices & Terms of Use
Uses of our Site and Content
Please read the following terms and conditions (“Terms”). They govern your use of this website (the “Site”), accessible through the Site, and its associated services, including email newsletters, associated content distribution platforms, and public online social media accounts of Tribe Capital Management, LLC (“Tribe Capital”) (collectively, the “Content”). By using the Content, you agree to be bound by these Terms. We may update these Terms from time to time and any modifications will be effective immediately upon posting unless we indicate otherwise. If you use the Content after any changes to the Terms have been posted, that means you agree to all of the changes. We suggest that you review these Terms periodically for changes.
Trademarks and Other Intellectual Property
Except as otherwise noted, all content and material on the Site and in the Content — including information, photos, podcasts, blog posts, social media posts, videos, graphics/charts, icons, code, design, and overall appearance — are the property of Tribe Capital and should not be used, modified, or reproduced without our prior written consent. All trademarks, trade names, and logos displayed on the Site and in the Content are the property of Tribe Capital, its affiliates, or their respective third-party owners, and the Content grants no license to them. TRIBE CAPITAL is a registered trademark in the United States and/or other countries and may not be used without the prior written permission of Tribe Capital.
No Offer or Advice
The Content included on the Site is for informational purposes only and does not constitute an offer to sell or buy any securities, financial instruments, investments or other services of Tribe Capital or any entity, and may not be used or relied upon in connection with any offer or sale of securities, financial instruments, investments or other services. An offer or solicitation will be made only through the applicable offering materials, subscription agreement and other related documents with respect to a particular investment opportunity and will be subject to the terms and conditions contained in such documents, including the qualifications necessary to become an investor.
Tribe Capital is an investment adviser registered with the Securities and Exchange Commission. The Content is intended solely to provide general information about Tribe Capital, its people, and its services to entrepreneurs, company founders, and prospective portfolio companies. The Content is not directed towards any existing or prospective investor in any Tribe Capital fund. Tribe Capital is not utilizing the Site to provide investment or other advice, and nothing on the Site is to be deemed a recommendation that you buy, sell, hold or make any other security or investment decision. The Site and its Content should not be relied upon for the purpose of making or communicating investment or other decisions nor construed as investment, legal, accounting, tax or other professional advice. To obtain such advice, you should consult with your own professional advisor. Any transactions listed on the Site are included as representative transactions and are not necessarily reflective of overall performance.
No Guarantee
There is no guarantee that any investment objective will be achieved. Past performance is not indicative of future results, which may vary. Actual results may differ materially from those expressed or implied. An investment with Tribe Capital is speculative and involves significant risks, including the potential loss of all or a substantial portion of invested capital, the use of leverage, and the lack of liquidity of an investment. Tribe Capital has invested and/or will from time to time invest in companies in the broader cryptoeconomy. Additionally, Tribe is expected to invest in investments in yield farming, staking, and DeFi investments. The engagement in these strategies will lead to certain risks to the Tribe funds and their investors. Investors or potential investors in the Tribe Funds should carefully evaluate all risks set forth in the relevant Tribe funds’ offering materials and other disclosure documents.
Forward-Looking Statements
The Contents and the Site may contain forward-looking statements that are based on beliefs, assumptions, current expectations, estimates, and projections about the financial industry, the economy, Tribe Capital itself or its investments. Forward-looking statements can be identified by the use of words such as “anticipate,” “intend,” “believe,” “estimate,” “plan,” “seek,” “project,” “expect,” “may,” “will,” “would,” “could” or “should,” the negative of these terms or other comparable terminology. Examples of forward-looking statements include statements relating to macroeconomic conditions, expectations regarding future growth, including future revenue and earnings increases, margins, free cash flow projections and annual growth rates; growth plans and opportunities, including our strategies for future or potential acquisitions, product expansion, targets and geographic expansion; estimated returns on in future; and assumptions underlying these expectations. These statements are not guarantees of future performance and involve certain risks, uncertainties and assumptions that are difficult to predict with regard to timing, extent, likelihood and degree of occurrence. Therefore, actual results and outcomes may materially differ from what may be expressed or forecasted in such forward-looking statements. Furthermore, Tribe Capital undertakes no obligation to update, amend or clarify forward-looking statements, whether as a result of new information, future events or otherwise.
Opinions and Views
Unless otherwise indicated or reasonably construed from context, any opinions expressed on the Site or in the Content reflect Tribe Capital’s views or those of individual posters, and are subject to change. Certain information contained on the Site or in the Content has been obtained from third-party sources, including from portfolio companies of funds managed by Tribe Capital. While taken from sources believed to be reliable, Tribe Capital has not independently verified such information and makes no representations about the enduring accuracy of the information or its appropriateness for a given situation. The content of this website is presented on an “as is” basis with no warranties, express or implied, of any kind with respect to the Site or Content. Charts provided herein are for informational purposes only and should not be relied upon when making any investment decision.
Registration as an investment adviser does not imply any special skill or training. Additional important information about Tribe Capital, including our Form ADV Part 2A Brochure, is available at the SEC’s website: http://www.adviserinfo.sec.gov.