 Print
PrintMichael Klausner is the Nancy and Charles Munger Professor of Business and Professor of Law at Stanford Law School; Michael Ohlrogge is Assistant Professor of Law at NYU School of Law; and Emily Ruan of Stanford University. This post is based on their recent paper.
1. Introduction
SPACs, or special purpose acquisition companies, have experienced a frenzy of activity and attention over the past year. In 2020, SPACs have already raised as much cash as they did over the entire preceding decade, with two-thirds of this cash raised in just the past three months. Press reports and blog commentary present SPACs as a clever financial innovation that provide a cheaper, faster, and more certain path to becoming a public company than does an IPO. Those reports, however, misunderstand the economics of SPACs. We have just posted a study of all 47 SPACs that merged between January 2019 and June 2020. That study addresses each of those claims. In this blog we focus on our findings regarding the cost of SPACs, which are very much at odds with the commentary one sees on nearly a daily basis.
In a nutshell, we find:
- Although SPACs issue shares for roughly $10 and value their shares at $10 when they merge, by the time of the merger the median SPAC holds cash of just $6.67 per share.
- The dilution embedded in SPACs constitutes a cost roughly twice as high as the cost generally attributed to SPACs, even by SPAC skeptics.
- When commentators say SPACs are a cheap way to go public, they are right, but only because SPAC investors are bearing the cost, which is an unsustainable situation.
- Although some SPACs with high-quality sponsors do better than others, SPAC investors that hold shares at the time of a SPAC’s merger see post-merger share prices drop on average by a third or more.
- Since the end of our study period, Pershing Square issued a SPAC with substantial improvements in the uniform structure of other SPACs. We propose, however, that more fundamental improvement is possible.
2. The SPAC Structure
SPACs raise cash in an IPO and then have two years to search for a private company with which to merge and thereby bring public. Their shares are redeemable at the time a merger is proposed, so if SPAC investors don’t like a proposed merger, they get back their full investment, plus a very high return.
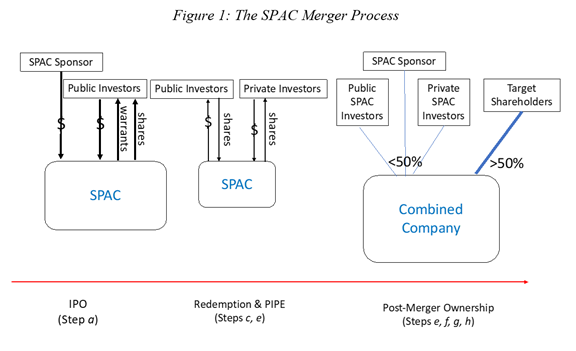
The primary source of SPACs’ high cost and poor post-merger performance is dilution built into the circuitous two-year route they take to bringing a company public. Along the way, SPACs give shares, warrants, and rights to parties that do not contribute cash to the eventual merger. Those essentially free securities dilute the value of shares that SPAC investors purchase. We illustrate this circuitous route in Figure 1: (a) a SPAC issues units consisting of redeemable shares and warrants in an IPO and at the same time the sponsor makes an investment to cover the SPAC’s costs between the IPO and its merger; (b) within two years, the SPAC’s sponsor proposes a merger by which a private company would go public; (c) typically about three quarters of the SPAC’s shares are redeemed; (d) contemporaneously with the merger, the SPAC issues new shares to the sponsor and/or third parties in private placements (PIPEs) to replenish some of the cash the SPAC paid out to redeem its shares; (e) the merger proceeds; (f) the SPAC’s remaining public shareholders, PIPE investors, and sponsor each own a small slice of the post-merger company’s equity.
Figure 1: The SPAC Merger Process
3. Dilution Inherent in the SPAC Structure
There are three sources of dilution inherent in the SPAC structure. First, SPAC sponsors compensate themselves with a “promote” consisting of shares equal to 25% of the SPAC’s IPO proceeds, or equivalently, 20% of post-IPO equity. Second, in order to attract IPO investors, SPACs promise a very attractive return for simply allowing the SPAC to hold their cash for two years. SPAC shareholders that redeem their shares receive the full price of the units sold in the IPO with interest—plus the right to keep the warrants included in the units for free. For SPACs in our study, that has amounted to an average annualized return of 11.6% for redeeming investors, with essentially no downside risk. Third, at the time of their IPO, SPACs pay an underwriting fee based on IPO proceeds, despite the fact that most shares sold in the IPO will be redeemed at the time of the merger. These three elements of SPACs dilute share value at the time of the SPAC’s merger, and impose a steep cost on either the shareholders of the SPAC or the shareholders of the company the SPAC takes public. We address below who bears that cost.
Redemptions also magnify the dilution initially caused by the promote and the warrants. Consider a hypothetical SPAC that sells 80 shares to the public and gives 20 shares to the sponsor for a nominal fee. That is, 80% of the shares are backed by cash, and 20% are not. If 50% of the SPAC’s 80 public shares are redeemed, the sponsor’s 20-share promote, initially equal to 25% of publicly owned shares, will equal 50% of the 40 remaining publicly owned shares. Equivalently, of the 60 shares remaining after redemptions, 67% have cash behind them, and 33% do not.
Redemption actually tends to be much higher than 50%. Mean and median redemptions for SPACs that merged between January 2019 and June 2020 were 58% and 73%, respectively. Over a third of those SPACs had redemptions of over 90%. To some extent, SPACs replenish the cash they lose to redemptions by selling new shares through private placements contemporaneously with their merger, but for most SPACs, the replacement is only partial.
4. The Cost of SPAC Dilution
When a SPAC merges, the value of a SPAC share is stated to be $10. This is necessary because the redemption price of a SPAC share is approximately $10 and therefore the pre-merger trading value of a SPAC share is no less than $10. Because of the dilution outlined above, however, SPACs do not have $10 of cash for each share outstanding. In Table 1, we show SPAC dilution as a percentage of cash that a SPAC delivers—that is, IPO proceeds, minus redemptions, plus new money raised in PIPEs. The median SPAC’s dilution amounts to a staggering 50.4% of cash delivered in a merger. This means that a SPAC with median dilution that delivers $1,000 in cash from selling 100 shares would have the equivalent of roughly 150 shares outstanding (treating warrants as fractions of shares based on their value). Another way to say this is that for each share purportedly worth $10, there is $6.67 in cash and $3.33 in dilution overhanging the merger. At the 75th percentile, there are the equivalent of 2.6 shares outstanding with no cash behind them for each share with cash.
Table 1: SPAC Costs as a % of Cash Delivered in Mergers (Including PIPEs)
| Median | 25th Percentile | 75th Percentile | |
|---|---|---|---|
| Net Promote | 31.3% | 14% | 140% |
| Underwriting Fee | 7.2% | 4% | 34% |
| Warrant + Right Cost | 16.6% | 9% | 77% |
| Total Costs | 50.4% | 29% | 261% |
Table 2 shows the same dilution shown in Table 1 above, but this time as a percentage of SPACs’ post-merger equity. At the median, the surplus that must be created for SPAC and target shareholders to break even is 14.1% of the post-merger company’s value. To the extent this does not occur, either the SPAC shareholders or the target, or both, will bear the cost.
Table 2: SPAC Costs as % Post-Merger Equity
| Median | 25th Percentile | 75th Percentile | |
|---|---|---|---|
| Net Promote | 7.7% | 5% | 12% |
| Underwriting Fee | 2.3% | 1% | 3% |
| Warrant + Right Cost | 4% | 3% | 7% |
| Total Costs | 14.1% | 10% | 21% |
5. Who Bears the Costs?
When a SPAC merges, SPAC shareholders must believe they will receive about $10 per share in value to justify giving up their option to redeem at about $10. Target shareholders, however, will not agree to a merger unless they receive shares in the post-merger company at least equal to their estimation of the pre-merger value of their shares. Therefore, if target shareholders value SPAC shares only at their cash value, and negotiate a deal based on that value, SPAC shareholders will see their shares fall in price following the merger. For example, for the median SPAC with $6.67 in cash per share before the merger, shares would drop to $6.67 after the merger. This would mean the target has gotten an even deal and the SPAC shareholders have borne the cost of the SPAC’s dilution. If both target and SPAC shareholders are to break even or come out ahead, the merger must create sufficient surplus to fill the hole created by the SPAC’s dilution. That surplus, if it exists, would consist of the value of the target becoming a public company plus value the sponsor creates by remaining engaged with the post-merger company.
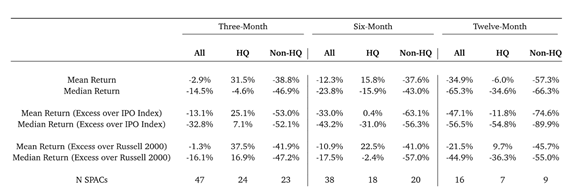
In order to analyze who bears the cost of SPAC dilution, we look at post-merger price performance. Table 3 presents three-, six-, and twelve-month post-merger returns for SPACs that merged between January 2019 and June 2020. By three months following a SPAC’s merger, median returns were negative 14.5% and median returns in excess of the Russell 2000 or the IPO index were even lower. Six-month returns were worse and twelve-month returns (for those SPACs with that much post-merger performance history) are worse still. A reasonable inference is that targets negotiated prices or share exchanges based on the cash value of SPAC shares, and that SPAC shareholders bore the cost of SPACs’ dilution.
We find further support for this inference in Figure 2, which shows a high correlation between stock drops and the amount of dilution in a SPAC at the time of its merger. SPACs with low cash per share see large post-merger price declines from the roughly $10 pre-merger share price. This relationship strongly implies that poor post-merger SPAC performance reflects the cost of the dilution embedded in SPACs—and that SPAC shareholders have generally borne that cost.
Commentators often highlight SPACs that have done well. These are generally SPACs sponsored by high-profile private equity firms, former CEOs of Fortune 500 companies, and others with high visibility. To explore the possibility that there is an identifiable subset of SPACs that have consistently done well, Figure 2 identifies SPACs with sponsors that are (a) private equity funds listed in Pitchbook as having assets under management of $1 billion or more or (b) former CEOs or senior officers of Fortune 500 companies. We label those SPACs as “high quality” or “HQ” (with apologies to high quality sponsors that do not meet this admittedly imperfect definition). SPACs with high quality sponsors tend to do better than other SPACs in two respects. First, their dilution is lower—although most still had $7 or less in cash per $10 share. Second, they produced higher six-month post-merger returns for SPAC shareholders—though many still lost value. The lower dilution is primarily due to fewer redemptions. The higher returns are presumably a function of value these sponsors created by promising to remain engaged in the post-merger company, or perhaps their ability to drive a harder bargain with targets. Figure 2 visually depicts returns for high quality and non-high-quality sponsors, and Table 3 presents additional details.
Figure 2: SPAC Dilution and 6-Month Post-Merger Returns
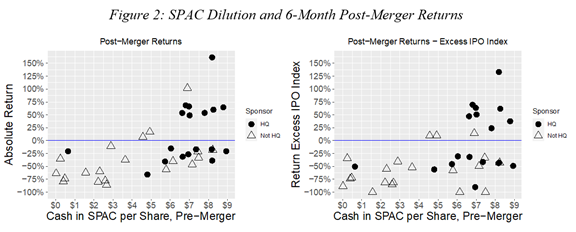
Table 3: Post-Merger SPAC Returns
6. SPAC Cost vs. IPO Cost
Some commentators have touted SPACs as a cheaper way to go public than IPOs. As the analysis above shows, however, the story is more complicated than that. If indeed SPACs are a cheaper way to go public than IPOs, it is only because SPAC shareholders are bearing the cost of SPACs and thereby subsidizing targets going public. It is difficult to believe that this will continue. Nonetheless, on the assumption that the market will before long force SPAC targets to bear the costs embedded in SPACs, we can compare SPAC and IPO costs.
The direct cost of an IPO is the underwriting fee, which is generally between 5% and 7%. In addition, however, some consider the “IPO pop” to be an additional and much larger cost of an IPO. If an IPO is offered at $10 per share and “pops” to $13 per share on the first day of trading, many consider this to be a 30% cost of the IPO. The assumption, which is contested, is that the issuer could have sold all its shares at $13. According to Jay Ritter’s data, from 2000 to 2019, the average pop on the first day of trading has been 14.8% of cash raised. Thus, total IPO costs, including the pop, are roughly 20% to 22% of cash raised in in an IPO. This is far less than the 50.4% median cost of a SPAC. So, if target shareholders were to bear the full brunt of the dilution inherent in SPACs’ structure, their cost of raising funds through a SPAC would be far greater than the cost of an IPO.
7. Capturing SPAC Benefits Without the High Costs
In addition to being touted as a cheaper route to the public markets than IPOs, SPACs are often viewed as providing other benefits over IPOs. These include better communication of a target’s story to investors through the work of the sponsor and through raising equity in PIPEs at the time of a SPAC’s merger. Relatedly, they are said to provide greater deal and price certainty. Even if these benefits are present—and we question many of them—the same benefits can be achieved without the high cost of a SPAC. Pershing Square has sponsored a SPAC with a very different and less dilutive structure, and a few other SPACs have gone public with no warrants and hence less dilution. Yet these remain the exceptions, not the rule. Furthermore, we wonder whether sponsors could help bring companies public at even lower cost without the SPAC structure. We propose that a sponsor identify a company first, negotiate a fee, commit to make an investment, attract third-party private placement investors, and either approach an underwriter for an IPO or assist in a direct listing.
The complete paper is available for download here.